Vodafone 2014 Annual Report Download - page 207
Download and view the complete annual report
Please find page 207 of the 2014 Vodafone annual report below. You can navigate through the pages in the report by either clicking on the pages listed below, or by using the keyword search tool below to find specific information within the annual report.-
 1
1 -
2
-
3
-
4
-
5
-
6
-
7
-
8
-
9
-
10
-
11
-
12
-
13
-
14
-
15
-
16
-
17
-
18
-
19
-
20
-
21
-
22
-
23
-
24
-
25
-
26
-
27
-
28
-
29
-
30
-
31
-
32
-
33
-
34
-
35
-
36
-
37
-
38
-
39
-
40
-
41
-
42
-
43
-
44
-
45
-
46
-
47
-
48
-
49
-
50
-
51
-
52
-
53
-
54
-
55
-
56
-
57
-
58
-
59
-
60
-
61
-
62
-
63
-
64
-
65
-
66
-
67
-
68
-
69
-
70
-
71
-
72
-
73
-
74
-
75
-
76
-
77
-
78
-
79
-
80
-
81
-
82
-
83
-
84
-
85
-
86
-
87
-
88
-
89
-
90
-
91
-
92
-
93
-
94
-
95
-
96
-
97
-
98
-
99
-
100
-
101
-
102
-
103
-
104
-
105
-
106
-
107
-
108
-
109
-
110
-
111
-
112
-
113
-
114
-
115
-
116
-
117
-
118
-
119
-
120
-
121
-
122
-
123
-
124
-
125
-
126
-
127
-
128
-
129
-
130
-
131
-
132
-
133
-
134
-
135
-
136
-
137
-
138
-
139
-
140
-
141
-
142
-
143
-
144
-
145
-
146
-
147
-
148
-
149
-
150
-
151
-
152
-
153
-
154
-
155
-
156
-
157
-
158
-
159
-
160
-
161
-
162
-
163
-
164
-
165
-
166
-
167
-
168
-
169
-
170
-
171
-
172
-
173
-
174
-
175
-
176
-
177
-
178
-
179
-
180
-
181
-
182
-
183
-
184
-
185
-
186
-
187
-
188
-
189
-
190
-
191
-
192
-
193
-
194
-
195
-
196
-
 197
197 -
 198
198 -
 199
199 -
 200
200 -
 201
201 -
 202
202 -
 203
203 -
 204
204 -
 205
205 -
 206
206 -
 207
207 -
 208
208 -
 209
209 -
 210
210 -
 211
211 -
 212
212 -
 213
213 -
 214
214 -
 215
215 -
 216
216
 |
 |

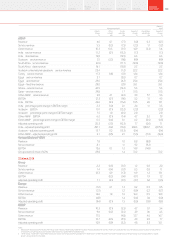
Management basis1
Statutory
basis1
Organic
change
%
Other
activity2
pps
Foreign
exchange
pps
Reported
change
%
Presentation
adjustments
pps
Reported
change
%
AMAP
Revenue 6.0 0.7 (7.7) (1.0) 0.3 (0.7)
Service revenue 5.5 (0.3) (7.5) (2.3) 1.1 (1.2)
Other revenue 10.3 10.3 (9.7) 10.9 (5.3) 5.6
India – service revenue 11.2 (0.1) (12.2) (1.1) –(1.1)
India – data revenue 19.8 –(13.5) 6.3 –6.3
Vodacom – service revenue 3.1 (3.2) (9.8) (9.9) –(9.9)
South Africa – service revenue (0.3) –(11.7) (12.0) –(12.0)
South Africa – data revenue 16.1 –(13.8) 2.3 –2.3
Vodacom’s international operations – service revenue 23.4 –(1.2) 22.2 –22.2
Turkey – service revenue 17.3 (1.8) (3.1) 12.4 –12.4
Egypt – service revenue 3.7 –(3.0) 0.7 –0.7
Egypt – data revenue 29.6 –(4.2) 25.4 –25.4
Egypt – xed line revenue 29.0 –(2.9) 26.1 –26.1
Ghana – service revenue 24.5 –(19.2) 5.3 –5.3
Qatar – service revenue 29.8 –1.7 31.5 –31.5
Other AMAP – service revenue 3.8 2.1 (2.0) 3.9 5.7 9.6
EBITDA 12.3 (0.1) (9.0) 3.2 1.1 4.3
India – EBITDA 24.0 (0.1) (13.4) 10.5 2.6 13.1
India – percentage point change in EBITDA margin 3.3 (1.0) 0.1 2.4 1.1 3.5
Vodacom – EBITDA 10.1 (0.1) (12.2) (2.2) –(2.2)
Vodacom – percentage point change in EBITDA margin 1.5 1.0 (0.5) 2.0 –2.0
Other AMAP – EBITDA 6.2 (0.1) (1.4) 4.7 3.2 7.9
Other AMAP – percentage point change in EBITDA margin 0.5 (0.4) 0.1 0.2 (0.5) (0.3)
Adjusted operating prot 20.3 (2.3) (10.3) 7.7 (0.6) 7.1
India – adjusted operating prot 291.1 (3.4) (19.4) 268.3 1,806.7 2,075.0
Vodacom – adjusted operating prot 12.7 0.2 (13.3) (0.4) –(0.4)
Other AMAP – adjusted operating prot 2.1 (9.5) 2.1 (5.3) (11.1) (16.4)
Verizon Wireless (‘VZW’)
Revenue 7.8 –1.0 8.8 (8.8) –
Service revenue 8.1 –1.1 9.2 (9.2) –
EBITDA 13.6 0.1 1.2 14.9 (14.9) –
Group’s share of result of VZW 29.8 –1.4 31.2 –31.2
31 March 2012
Group
Revenue 2.2 (0.3) (0.7) 1.2 0.8 2.0
Service revenue 1.4 (0.4) (0.7) 0.3 0.8 1.1
Other revenue 12.3 0.9 (1.3) 11.9 1.2 13.1
EBITDA –(0.3) (0.4) (0.7) 1.9 1.2
Adjusted operating prot 1.1 (4.1) (0.7) (3.7) 0.4 (3.3)
Europe
Revenue (1.2) 0.1 1.3 0.2 0.3 0.5
Service revenue (2.1) –1.2 (0.9) 0.2 (0.7)
Other revenue 13.6 1.8 1.0 16.4 0.5 16.9
EBITDA (4.8) –1.4 (3.4) 0.4 (3.0)
Adjusted operating prot (9.4) (0.1) 1.5 (8.0) (0.9) (8.9)
AMAP
Revenue 10.3 (0.1) (5.5) 4.7 0.7 5.4
Service revenue 9.6 (0.2) (5.5) 3.9 0.6 4.5
Other revenue 17.5 –(4.8) 12.7 4.0 16.7
EBITDA 10.7 (0.3) (5.5) 4.9 2.8 7.7
Adjusted operating prot 10.9 (0.9) (5.2) 4.8 5.3 10.1
Notes:
1 Management basis includes the results of the Group’s joint ventures, Vodafone Italy, Vodafone Hutchison Australia, Vodafone Fiji and Indus Towers, on a proportionate basis. The statutory basis includes the results of these
joint ventures, using the equity accounting basis rather than on a proportionate consolidation basis.
2 “Other activity” includes the impact of M&A activity, the revision to intra-group roaming charges from 1 October 2011, and the impact of Indus Towers revising its accounting for energy cost recharges. Refer to “Organic
growth” on page 202 for further detail.
205Overview Strategy
review Performance Governance Financials Additional
information