Vodafone 2014 Annual Report Download - page 157
Download and view the complete annual report
Please find page 157 of the 2014 Vodafone annual report below. You can navigate through the pages in the report by either clicking on the pages listed below, or by using the keyword search tool below to find specific information within the annual report.-
 1
1 -
2
-
3
-
4
-
5
-
6
-
7
-
8
-
9
-
10
-
11
-
12
-
13
-
14
-
15
-
16
-
17
-
18
-
19
-
20
-
21
-
22
-
23
-
24
-
25
-
26
-
27
-
28
-
29
-
30
-
31
-
32
-
33
-
34
-
35
-
36
-
37
-
38
-
39
-
40
-
41
-
42
-
43
-
44
-
45
-
46
-
47
-
48
-
49
-
50
-
51
-
52
-
53
-
54
-
55
-
56
-
57
-
58
-
59
-
60
-
61
-
62
-
63
-
64
-
65
-
66
-
67
-
68
-
69
-
70
-
71
-
72
-
73
-
74
-
75
-
76
-
77
-
78
-
79
-
80
-
81
-
82
-
83
-
84
-
85
-
86
-
87
-
88
-
89
-
90
-
91
-
92
-
93
-
94
-
95
-
96
-
97
-
98
-
99
-
100
-
101
-
102
-
103
-
104
-
105
-
106
-
107
-
108
-
109
-
110
-
111
-
112
-
113
-
114
-
115
-
116
-
117
-
118
-
119
-
120
-
121
-
122
-
123
-
124
-
125
-
126
-
127
-
128
-
129
-
130
-
131
-
132
-
133
-
134
-
135
-
136
-
137
-
138
-
139
-
140
-
141
-
142
-
143
-
144
-
145
-
146
-
 147
147 -
 148
148 -
 149
149 -
 150
150 -
 151
151 -
 152
152 -
 153
153 -
 154
154 -
 155
155 -
 156
156 -
 157
157 -
 158
158 -
 159
159 -
 160
160 -
 161
161 -
 162
162 -
 163
163 -
 164
164 -
 165
165 -
 166
166 -
 167
167 -
168
-
169
-
170
-
171
-
172
-
173
-
174
-
175
-
176
-
177
-
178
-
179
-
180
-
181
-
182
-
183
-
184
-
185
-
186
-
187
-
188
-
189
-
190
-
191
-
192
-
193
-
194
-
195
-
196
-
197
-
198
-
199
-
200
-
201
-
202
-
203
-
204
-
205
-
206
-
207
-
208
-
209
-
210
-
211
-
212
-
213
-
214
-
215
-
216
 |
 |
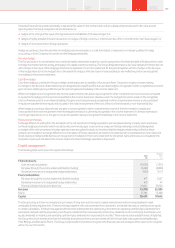
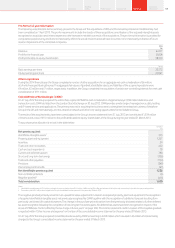
Fair value of the assets and present value of the liabilities of the schemes
The amount included in the statement of nancial position arising from the Group’s obligations in respect of its dened benet schemes is as follows:
2014
Restated
2013
Restated
2012
£m £m £m
Movement in pension assets:
1 April 3,723 1,604 1,558
Exchange rate movements (13) 6(22)
Interest income 162 125 86
Return on plan assets excluding interest income (114) 210 (17)
Employer cash contributions 51 100 31
Member cash contributions 786
Benets paid (81) (60) (39)
Assets assumed in business combinations –1,730 –
Other movements 107 – 1
31 March 3,842 3,723 1,604
Movement in pension liabilities:
1 April 4,251 1,865 1,501
Exchange rate movements (17) 9(30)
Service cost 14 27 12
Interest cost 182 137 83
Member cash contributions 786
Remeasurements:
Actuarial losses/(gains) arising from changes in demographic assumptions (35) – –
Actuarial losses/(gains) arising from changes in nancial assumptions (44) 441 314
Actuarial losses/(gains) arising from experience adjustments (92) 721
Benets paid (81) (60) (39)
Liabilities assumed in business combinations 121 1,772 2
Other movements 85 45 (5)
31 March 4,391 4,251 1,865
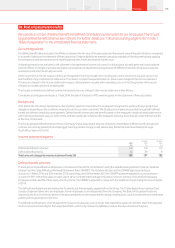
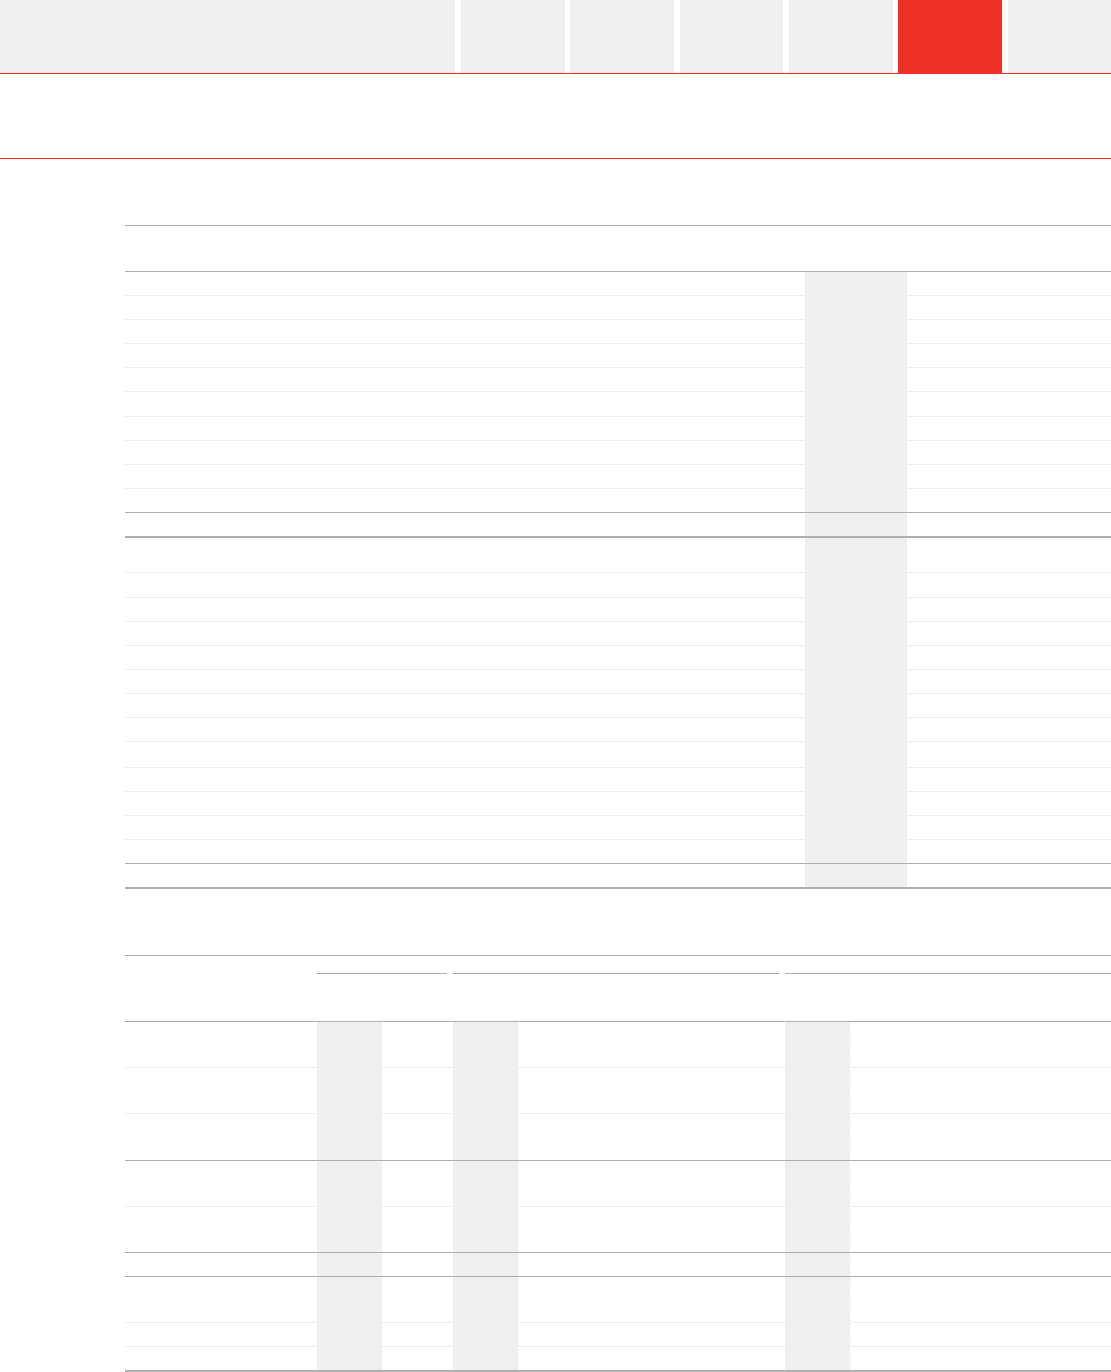
An analysis of net (decit)/assets is provided below for the Group’s two largest dened benet pension schemes in the UK and for the Group
as a whole.
CWWRP Vodafone UK plan Group
2014 2013 2014 2013 2012 2011 2010 2014
Restated
2013
Restated
2012
Restated
2011
Restated
2010
£m £m £m £m £m £m £m £m £m £m £m £m
Analysis of net
(decit)/assets:
Total fair value of scheme
assets 1,780 1,827 1,343 1,328 1,218 1,180 1,131 3,842 3,723 1,604 1,558 1,487
Present value of funded
schemeliabilities (1,732) (1,874) (1,677) (1,647) (1,444) (1,127) (1,276) (4,325) (4,239) (1,853) (1,488) (1,625)
Net (deficit)/assets for
funded schemes 48 (47) (334) (319) (226) 53 (145) (483) (516) (249) 70 (138)
Present value of unfunded
scheme liabilities – – – – – – – (66) (12) (12) (13) (15)
Net (decit)/assets 48 (47) (334) (319) (226) 53 (145) (549) (528) (261) 57 (153)
Net (decit)/assets are
analysed as:
Assets 48 – – – – 53 – 35 52 31 97 34
Liabilities –(47) (334) (319) (226) – (145) (584) (580) (292) (40) (187)
Vodafone Group Plc
Annual Report 2014 155Overview
Strategy
review Performance Governance Financials Additional
information