Vodafone 2014 Annual Report Download - page 143
Download and view the complete annual report
Please find page 143 of the 2014 Vodafone annual report below. You can navigate through the pages in the report by either clicking on the pages listed below, or by using the keyword search tool below to find specific information within the annual report.-
 1
1 -
2
-
3
-
4
-
5
-
6
-
7
-
8
-
9
-
10
-
11
-
12
-
13
-
14
-
15
-
16
-
17
-
18
-
19
-
20
-
21
-
22
-
23
-
24
-
25
-
26
-
27
-
28
-
29
-
30
-
31
-
32
-
33
-
34
-
35
-
36
-
37
-
38
-
39
-
40
-
41
-
42
-
43
-
44
-
45
-
46
-
47
-
48
-
49
-
50
-
51
-
52
-
53
-
54
-
55
-
56
-
57
-
58
-
59
-
60
-
61
-
62
-
63
-
64
-
65
-
66
-
67
-
68
-
69
-
70
-
71
-
72
-
73
-
74
-
75
-
76
-
77
-
78
-
79
-
80
-
81
-
82
-
83
-
84
-
85
-
86
-
87
-
88
-
89
-
90
-
91
-
92
-
93
-
94
-
95
-
96
-
97
-
98
-
99
-
100
-
101
-
102
-
103
-
104
-
105
-
106
-
107
-
108
-
109
-
110
-
111
-
112
-
113
-
114
-
115
-
116
-
117
-
118
-
119
-
120
-
121
-
122
-
123
-
124
-
125
-
126
-
127
-
128
-
129
-
130
-
131
-
132
-
 133
133 -
 134
134 -
 135
135 -
 136
136 -
 137
137 -
 138
138 -
 139
139 -
 140
140 -
 141
141 -
 142
142 -
 143
143 -
 144
144 -
 145
145 -
 146
146 -
 147
147 -
 148
148 -
 149
149 -
 150
150 -
 151
151 -
 152
152 -
 153
153 -
154
-
155
-
156
-
157
-
158
-
159
-
160
-
161
-
162
-
163
-
164
-
165
-
166
-
167
-
168
-
169
-
170
-
171
-
172
-
173
-
174
-
175
-
176
-
177
-
178
-
179
-
180
-
181
-
182
-
183
-
184
-
185
-
186
-
187
-
188
-
189
-
190
-
191
-
192
-
193
-
194
-
195
-
196
-
197
-
198
-
199
-
200
-
201
-
202
-
203
-
204
-
205
-
206
-
207
-
208
-
209
-
210
-
211
-
212
-
213
-
214
-
215
-
216
 |
 |

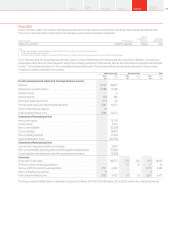
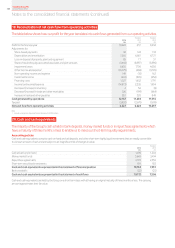
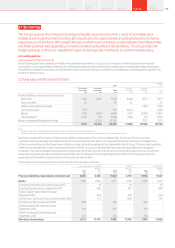
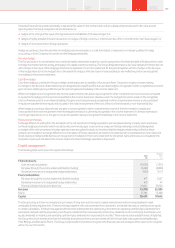
Fair values are calculated using quoted market prices or discounted cash ows with a discount rate based upon forward interest rates available to the
Group at the reporting date.
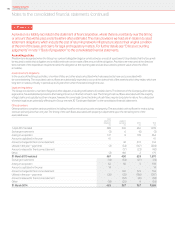
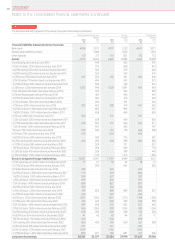
Maturity of borrowings
The maturity prole of the anticipated future cash ows including interest in relation to the Group’s non-derivative nancial liabilities on an
undiscounted basis which, therefore, differs from both the carrying value and fair value, is as follows:
Redeemable Loans in
Bank preference Commercial Other designated hedge
loans shares paper Bonds liabilities relationships Total
£m £m £m £m £m £m £m
Within one year 1,286 –954 2,191 3,758 453 8,642
In one to two years 695 – – 1,709 11 890 3,305
In two to three years 375 – – 591 71,228 2,201
In three to four years 1,164 – – 1,075 82,468 4,715
In four to ve years 2,710 – – 1,724 8668 5,110
In more than ve years 592 – – – 69 11,087 11,748
6,822 –954 7,290 3,861 16,794 35,721
Effect of discount/nancing rates (912) –(4) (1,042) – (4,562) (6,520)
31 March 2014 5,910 –950 6,248 3,861 12,232 29,201
Within one year 2,269 56 4,070 2,946 2,263 277 11,881
In one to two years 402 56 – 3,313 138 870 4,779
In two to three years 305 56 – 4,753 1,101 266 6,481
In three to four years 230 56 – 1,636 599 245 2,766
In four to ve years 1,007 56 – 3,156 72 245 4,536
In more than ve years 1,835 1,212 – 5,877 52 7,913 16,889
6,048 1,492 4,070 21,681 4,225 9,816 47,332
Effect of discount/nancing rates (531) (137) (16) (3,850) (299) (2,795) (7,628)
31 March 2013 restated 5,517 1,355 4,054 17,831 3,926 7,021 39,704
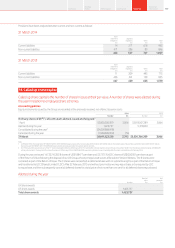
The maturity prole of the Group’s nancial derivatives (which include interest rate and foreign exchange swaps), using undiscounted cash ows,
is as follows:
2014 2013
Payable Receivable Payable Receivable
£m £m £m £m
Within one year 1,284 1,442 10,671 11,020
In one to two years 2,454 3,656 1,014 1,214
In two to three years 4,489 3,920 1,308 1,495
In three to four years 5,040 3,138 2,803 3,087
In four to ve years 1,729 2,137 581 780
In more than ve years 14,799 12,737 3,579 4,454
29,795 27,030 19,956 22,050
The currency split of the Group’s foreign exchange derivatives is as follows:
2014 2013
Payable Receivable Payable Receivable
£m £m £m £m
Sterling 8,955 9,222 2,365 4,477
Euro 5,342 11,364 6,583 602
US dollar 10,613 4,330 348 6,130
Japanese yen 589 17 669 1,296
Other 1,880 2,765 3,945 1,768
27,379 27,698 13,910 14,273
Payables and receivables are stated separately in the table above as settlement is on a gross basis. The £319 million (2013: £363 million)
net receivable in relation to foreign exchange nancial instruments in the table above is split £246 million (2013: £44 million) within trade and other
payables and £565 million (2013: £407 million) within trade and other receivables.
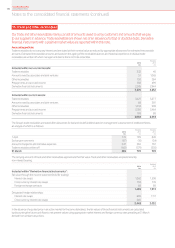
The present value of minimum lease payments under nance lease arrangements under which the Group has leased certain of its equipment
is analysed as follows:
2014 2013
£m £m
Within one year 21 37
In two to ve years 34 42
In more than ve years 69 53
Vodafone Group Plc
Annual Report 2014 141Overview
Strategy
review Performance Governance Financials Additional
information