Vodafone 2014 Annual Report Download - page 40
Download and view the complete annual report
Please find page 40 of the 2014 Vodafone annual report below. You can navigate through the pages in the report by either clicking on the pages listed below, or by using the keyword search tool below to find specific information within the annual report.
Our nancial performance
was mixed
Our nancial performance reects continued strong growth
in our emerging markets, partly offsetting competitive, regulatory and
macroeconomic pressures in Europe. While we have seen declines in our
revenue and EBITDA, we have met our nancial guidance and increased
the dividend per share.
Overall performance
The Group’s emerging markets businesses have delivered strong
organic growth this year, combining good local execution on marketing
and distribution with leading network quality. In particular, data usage
in emerging markets is really taking off, providing further growth
potential for the Group. This has however been offset by signicant
ongoing pressures in our European operations, from a combination
of a weak macroeconomic environment, regulatory headwinds,
and stiffcompetition. We experienced revenue declines in all of our
major European markets, and related pressure on margins, despite
continuing measures to control costs.
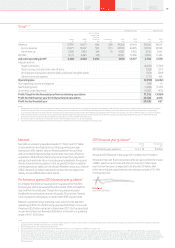
Group revenue for the year fell 3.5%* to £43.6 billion, with Group
organic service revenue down 4.3%*. Our AMAP region service revenue
continued to perform strongly, growing 6.1%*, driven by our major
emerging markets (India +13.0%*, Vodacom +4.1%*, Turkey +7.9%*).
The Group EBITDA1 margin fell 1.3* percentage points on an organic
basis, as the impact of steep revenue declines in Europe offset improving
margins in AMAP, notably in India and Australia. Group EBITDA1 fell 7.4%*
to £12.8 billion.
Group adjusted operating prot1 fell 9.4%* year-on-year to £7.9 billion
largely reecting the decline in EBITDA1, and includes a £3.2 billion
prot contribution from Verizon Wireless to 2 September 2013.
Adjusted operating prot on a pro forma guidance basis was £4.9 billion2.
Verizon Wireless
The prot contribution of Verizon Wireless is reported in our 2014
nancial year results for ve months to 2 September 2013, the date
we announced its sale. Our share of Verizon Wireless’ prots for this ve
month period amounted to £3.2 billion. The sale of the US group, whose
principal asset was Verizon Wireless, led to a pre-tax gain on disposal
of £45.0 billion.
Impairment losses
We recorded impairment charges of £6.6 billion relating to our
businesses in Germany, Spain, Portugal, Czech Republic and Romania.
These were driven by lower projected cash ows within business plans,
resulting from the tougher macroeconomic environment and heavy
price competition.
Financing costs and taxation
On a statutory basis, net nancing costs have decreased 6.4% primarily
due to the recognition of mark-to-market gains, offset by a £99 million
loss (2013: £nil) on the redemption of US$5.65 billion bonds as part
of the restructuring of the Group’s nancing arrangements following the
disposal of Verizon Wireless and lower interest income on settlement
of tax issues.
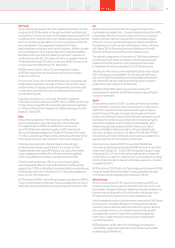
The adjusted effective tax rate for the year ended 31 March 2014 was
27.3%, in line with our expectation for the year. Our adjusted effective
tax rate does not include the impact of the recognition of an additional
deferred tax asset in respect of the Group’s historic tax losses in Germany
(£1,916 million) and Luxembourg (£17,402 million), and the estimated
US tax liability (£2,210 million) relating to the rationalisation and
reorganisation of our non-US assets prior to the disposal of our interest
in Verizon Wireless.
Adjusted earnings per share
Adjusted earnings per share1 fell 12.8% to 17.54 pence, driven by lower
adjusted operating prot, offset by a lower share count arising from the
Group’s share buyback programme. The Board is recommending a nal
dividend per share of 7.47 pence, to give total ordinary dividends per
share for the year of 11.0 pence, up 8% year-on-year.
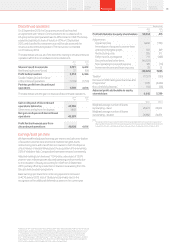
Free cash ow
Free cash ow was £4.4 billion, down 21.5% from the prior year. On a pro
forma guidance basis, free cash ow was £4.8 billion2, within our
guidance range of £4.5 billion to £5.0 billion for the year. The year-on-
year decline reects the relative strength of sterling against the South
African rand and Indian rupee over the course of the year, partly
offset by movements in the euro, as well as tough trading conditions.
In addition to the free cash ow reported above, we received an income
dividend of £2.1 billion from Verizon Wireless.
Capital expenditure
Capital expenditure increased 13.3% to £7.1 billion, with the growth
driven by the inclusion of CWW for 12 months, the inclusion of KDG
from October 2013, the commencement of our bre roll-out in Spain,
and initial Project Spring investments in Germany and India. In addition,
we acquired and renewed spectrum for £2.2 billion in India, Romania,
New Zealand and the Czech Republic, with a cash cost of £0.9 billion
during the year.
Vodafone Group Plc
Annual Report 201438
Chief Financial Ofcer’s review


