Vodafone 2014 Annual Report Download - page 126
Download and view the complete annual report
Please find page 126 of the 2014 Vodafone annual report below. You can navigate through the pages in the report by either clicking on the pages listed below, or by using the keyword search tool below to find specific information within the annual report.-
 1
1 -
2
-
3
-
4
-
5
-
6
-
7
-
8
-
9
-
10
-
11
-
12
-
13
-
14
-
15
-
16
-
17
-
18
-
19
-
20
-
21
-
22
-
23
-
24
-
25
-
26
-
27
-
28
-
29
-
30
-
31
-
32
-
33
-
34
-
35
-
36
-
37
-
38
-
39
-
40
-
41
-
42
-
43
-
44
-
45
-
46
-
47
-
48
-
49
-
50
-
51
-
52
-
53
-
54
-
55
-
56
-
57
-
58
-
59
-
60
-
61
-
62
-
63
-
64
-
65
-
66
-
67
-
68
-
69
-
70
-
71
-
72
-
73
-
74
-
75
-
76
-
77
-
78
-
79
-
80
-
81
-
82
-
83
-
84
-
85
-
86
-
87
-
88
-
89
-
90
-
91
-
92
-
93
-
94
-
95
-
96
-
97
-
98
-
99
-
100
-
101
-
102
-
103
-
104
-
105
-
106
-
107
-
108
-
109
-
110
-
111
-
112
-
113
-
114
-
115
-
 116
116 -
 117
117 -
 118
118 -
 119
119 -
 120
120 -
 121
121 -
 122
122 -
 123
123 -
 124
124 -
 125
125 -
 126
126 -
 127
127 -
 128
128 -
 129
129 -
 130
130 -
 131
131 -
 132
132 -
 133
133 -
 134
134 -
 135
135 -
 136
136 -
137
-
138
-
139
-
140
-
141
-
142
-
143
-
144
-
145
-
146
-
147
-
148
-
149
-
150
-
151
-
152
-
153
-
154
-
155
-
156
-
157
-
158
-
159
-
160
-
161
-
162
-
163
-
164
-
165
-
166
-
167
-
168
-
169
-
170
-
171
-
172
-
173
-
174
-
175
-
176
-
177
-
178
-
179
-
180
-
181
-
182
-
183
-
184
-
185
-
186
-
187
-
188
-
189
-
190
-
191
-
192
-
193
-
194
-
195
-
196
-
197
-
198
-
199
-
200
-
201
-
202
-
203
-
204
-
205
-
206
-
207
-
208
-
209
-
210
-
211
-
212
-
213
-
214
-
215
-
216
 |
 |

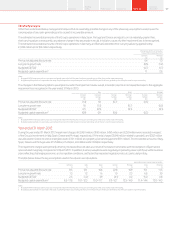
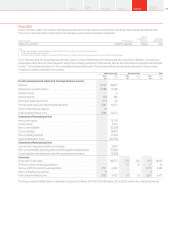
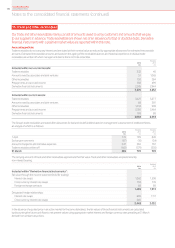
8. Earnings per share
Basic earnings per share is the amount of prot generated for the nancial year attributable to equity shareholders
divided by the weighted average number of shares in issue during the year.
2014
Restated
2013
Restated
2012
Millions Millions Millions
Weighted average number of shares for basic earnings per share 26,472 26,831 27,624
Effect of dilutive potential shares: restricted shares and share options 210 –314
Weighted average number of shares for diluted earnings per share 26,682 26,831 27,938
2014
£m
Restated
2013
£m
Restated
2012
£m
Earnings for basic and diluted earnings per share 59,254 413 6,948
Basic earnings per share 223.84p 1.54p 25.15p
Diluted earnings per share 222.07p 1.54p 24.87p
On 19 February 2014, we announced a “6 for 11” share consolidation effective 24 February 2014. This had the effect of reducing the number
of shares in issue from 52,821,751,216 ordinary shares (including 4,351,833,492 ordinary shares held in Treasury) as at the close of business
on 18 February 2014 to 28,811,864,298 new ordinary shares in issue immediately after the share consolidation on 24 February 2014. Prior year
comparatives have been restated.
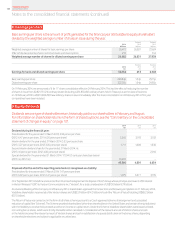
9. Equity dividends
Dividends are one type of shareholder return, historically paid to our shareholders in February and August.
Forinformation on shareholder returns in the form of share buybacks, see the “Commentary on the consolidated
statement of changes in equity” on page 101.
2014 2013 2012
£m £m £m
Declared during the nancial year:
Final dividend for the year ended 31 March 2013: 6.92 pence per share
(2012: 6.47 pence per share, 2011: 6.05 pence per share) 3,365 3,193 3,102
Interim dividend for the year ended 31 March 2014: 3.53 pence per share
(2013: 3.27 pence per share, 2012: 3.05 pence per share) 1,711 1,608 1,536
Second interim dividend share for the year ended 31 March 2014: nil
(2013: nil pence per share, 2012: 4.00 pence per share) – – 2,016
Special dividend for the year ended 31 March 2014: 172.94 US cents per share (see below)
(2013: nil, 2012: nil) 35,490 ––
40,566 4,801 6,654
Proposed after the end of the reporting period and not recognised as a liability:
Final dividend for the year ended 31 March 2014: 7.47 pence per share
(2013: 6.92 pence per share, 2012: 6.47 pence per share) 1,975 3,377 3,195
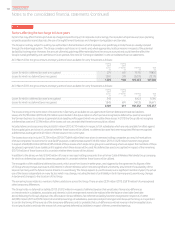
On 2 September 2013 Vodafone announced that it had reached agreement to dispose of its US Group whose principal asset was its 45% interest
in Verizon Wireless (‘VZW’) to Verizon Communications Inc. (‘Verizon’), for a total consideration of US$130 billion (£79 billion).
At a General Meeting of the Company on 28 January 2014, shareholders approved the transactions and following completion on 21 February 2014,
Vodafone shareholders received all of the Verizon shares and US$23.9 billion (£14.3 billion) of cash (the ‘Return of Value’) totalling US$85.2 billion
(£51.0 billion).
The Return of Value was carried out in the form of a B share scheme pursuant to a Court-approved scheme of arrangement and associated
reduction of capital (the ‘Scheme’). The Scheme provided shareholders (other than shareholders in the United States and certain other jurisdictions)
with the exibility to receive their proceeds as either an income or capital return. Under the Scheme, Vodafone shareholders were issued unlisted,
non-voting bonus shares, which were shortly thereafter either cancelled in consideration of the relevant amount of Verizon shares and cash
or the holders received the relevant amount of Verizon shares and cash in satisfaction of a special distribution on the bonus shares, depending
on shareholder elections and subject to applicable securities laws.
Notes to the consolidated nancial statements (continued)
Vodafone Group Plc
Annual Report 2014124