Vodafone 2014 Annual Report Download - page 45
Download and view the complete annual report
Please find page 45 of the 2014 Vodafone annual report below. You can navigate through the pages in the report by either clicking on the pages listed below, or by using the keyword search tool below to find specific information within the annual report.-
 1
1 -
2
-
3
-
4
-
5
-
6
-
7
-
8
-
9
-
10
-
11
-
12
-
13
-
14
-
15
-
16
-
17
-
18
-
19
-
20
-
21
-
22
-
23
-
24
-
25
-
26
-
27
-
28
-
29
-
30
-
31
-
32
-
33
-
34
-
 35
35 -
 36
36 -
 37
37 -
 38
38 -
 39
39 -
 40
40 -
 41
41 -
 42
42 -
 43
43 -
 44
44 -
 45
45 -
 46
46 -
 47
47 -
 48
48 -
 49
49 -
 50
50 -
 51
51 -
 52
52 -
 53
53 -
 54
54 -
 55
55 -
56
-
57
-
58
-
59
-
60
-
61
-
62
-
63
-
64
-
65
-
66
-
67
-
68
-
69
-
70
-
71
-
72
-
73
-
74
-
75
-
76
-
77
-
78
-
79
-
80
-
81
-
82
-
83
-
84
-
85
-
86
-
87
-
88
-
89
-
90
-
91
-
92
-
93
-
94
-
95
-
96
-
97
-
98
-
99
-
100
-
101
-
102
-
103
-
104
-
105
-
106
-
107
-
108
-
109
-
110
-
111
-
112
-
113
-
114
-
115
-
116
-
117
-
118
-
119
-
120
-
121
-
122
-
123
-
124
-
125
-
126
-
127
-
128
-
129
-
130
-
131
-
132
-
133
-
134
-
135
-
136
-
137
-
138
-
139
-
140
-
141
-
142
-
143
-
144
-
145
-
146
-
147
-
148
-
149
-
150
-
151
-
152
-
153
-
154
-
155
-
156
-
157
-
158
-
159
-
160
-
161
-
162
-
163
-
164
-
165
-
166
-
167
-
168
-
169
-
170
-
171
-
172
-
173
-
174
-
175
-
176
-
177
-
178
-
179
-
180
-
181
-
182
-
183
-
184
-
185
-
186
-
187
-
188
-
189
-
190
-
191
-
192
-
193
-
194
-
195
-
196
-
197
-
198
-
199
-
200
-
201
-
202
-
203
-
204
-
205
-
206
-
207
-
208
-
209
-
210
-
211
-
212
-
213
-
214
-
215
-
216
 |
 |

Other AMAP
Service revenue increased 2.8%*, with growth in Turkey, Egypt,
Qatar and Ghana being partially offset by declines in Australia and
New Zealand.
Service revenue growth in Turkey was 7.9%* after a 5.4 percentage point
negative impact from voice and SMS MTR cuts effective from 1 July
2013. Mobile in-bundle revenue in Turkey grew 25.0%* driven by higher
smartphone penetration, the success of Vodafone Red plans and
continued growth in enterprise.
In Egypt service revenue increased 2.6%*, driven by the growth in the
customer base, higher data usage and a successful pricing strategy.
Service revenue growth in Qatar came as a result of strong net customer
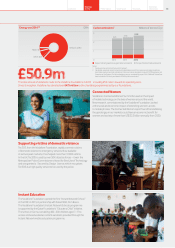
additions and the success of segmented commercial offers. In Ghana,
service revenue grew 19.3%*, driven by an increase in customers and
higher data usage in both consumer and enterprise.
EBITDA grew 19.3%* with a 3.1* percentage point improvement
in EBITDA margin, with improvements in Turkey, Australia, Qatar and
Ghana driven by the increase in scale and operating cost efciencies,
and with robust contribution from Egypt, partially offset by a decline
in New Zealand.
Our joint venture in Australia experienced a service revenue decline
of 9.0%*. The turnaround plan remains on track, yielding improved
levels of network performance, net promoter score and customer base
management. The EBITDA margin was improved by 14.8* percentage
points, as a result of restructuring and stronger cost discipline.
Our associate in Kenya, Safaricom, increased service revenue by 17.2%
driven by a higher customer base and continued growth in M-Pesa.
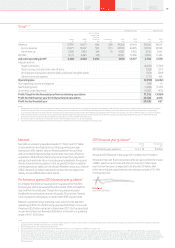
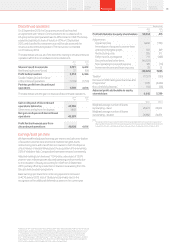
Non-Controlled Interests
Verizon Wireless1,2
2014
£m
2013
£m
Revenue 9,955 21,972
Service revenue 9,000 19,697
Other revenue 955 2,275
EBITDA 4 , 274 8,831
Interest (20) (25)
Tax2(50) 13
Group’s share of result inVZW 3 ,169 6,500
Notes:
1 All amounts represent the Group’s share based on its 45% partnership interest, unless otherwise stated.
Results for the year ended 31 March 2014 only include results to 2 September 2013, the date the Group
announced its intention to dispose of its 45% interest.
2 The Group’s share of the tax attributable to VZW relates only to the corporate entities held by the VZW
partnership and certain US state taxes which are levied on the partnership. The tax attributable to the
Group’s share of the partnership’s pre-tax prot is included within the Group tax charge.
On 2 September 2013 Vodafone announced it had reached
an agreement with Verizon Communications Inc. to dispose of its
US group whose principal asset was its 45% interest in Verizon Wireless.
The Group ceased recognising its share of results in Verizon Wireless
on 2 September 2013, and classied its investment as a held for sale
asset and the results as a discontinued operation. The transaction
completed on 21 February 2014.
Annual Report 2014 43Overview
Strategy
review Performance Governance Financials
Additional
information