Vodafone 2014 Annual Report Download - page 133
Download and view the complete annual report
Please find page 133 of the 2014 Vodafone annual report below. You can navigate through the pages in the report by either clicking on the pages listed below, or by using the keyword search tool below to find specific information within the annual report.-
 1
1 -
2
-
3
-
4
-
5
-
6
-
7
-
8
-
9
-
10
-
11
-
12
-
13
-
14
-
15
-
16
-
17
-
18
-
19
-
20
-
21
-
22
-
23
-
24
-
25
-
26
-
27
-
28
-
29
-
30
-
31
-
32
-
33
-
34
-
35
-
36
-
37
-
38
-
39
-
40
-
41
-
42
-
43
-
44
-
45
-
46
-
47
-
48
-
49
-
50
-
51
-
52
-
53
-
54
-
55
-
56
-
57
-
58
-
59
-
60
-
61
-
62
-
63
-
64
-
65
-
66
-
67
-
68
-
69
-
70
-
71
-
72
-
73
-
74
-
75
-
76
-
77
-
78
-
79
-
80
-
81
-
82
-
83
-
84
-
85
-
86
-
87
-
88
-
89
-
90
-
91
-
92
-
93
-
94
-
95
-
96
-
97
-
98
-
99
-
100
-
101
-
102
-
103
-
104
-
105
-
106
-
107
-
108
-
109
-
110
-
111
-
112
-
113
-
114
-
115
-
116
-
117
-
118
-
119
-
120
-
121
-
122
-
 123
123 -
 124
124 -
 125
125 -
 126
126 -
 127
127 -
 128
128 -
 129
129 -
 130
130 -
 131
131 -
 132
132 -
 133
133 -
 134
134 -
 135
135 -
 136
136 -
 137
137 -
 138
138 -
 139
139 -
 140
140 -
 141
141 -
 142
142 -
 143
143 -
144
-
145
-
146
-
147
-
148
-
149
-
150
-
151
-
152
-
153
-
154
-
155
-
156
-
157
-
158
-
159
-
160
-
161
-
162
-
163
-
164
-
165
-
166
-
167
-
168
-
169
-
170
-
171
-
172
-
173
-
174
-
175
-
176
-
177
-
178
-
179
-
180
-
181
-
182
-
183
-
184
-
185
-
186
-
187
-
188
-
189
-
190
-
191
-
192
-
193
-
194
-
195
-
196
-
197
-
198
-
199
-
200
-
201
-
202
-
203
-
204
-
205
-
206
-
207
-
208
-
209
-
210
-
211
-
212
-
213
-
214
-
215
-
216
 |
 |
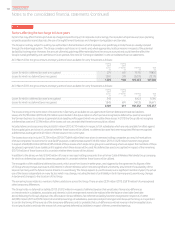
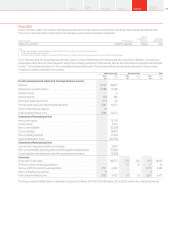
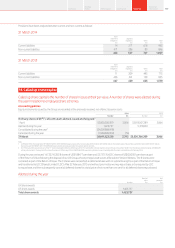
Associates
Unless otherwise stated, the Company’s principal associates all have share capital consisting solely of ordinary shares and are all indirectly held.
The country of incorporation or registration of all associates is also their principal place of operation.
Name of associate Principal activity
Country of
incorporation or
registration
Percentage1
shareholdings
Safaricom Limited2,3 Network operator Kenya 40.0
Notes:
1 Effective ownership percentages of Vodafone Group Plc at 31 March 2014, rounded to the nearest tenth of one percent.
2 The Group also holds two non-voting shares.
3 At 31 March 2014 the fair value of Safaricom Limited was KES 198 billion (£1,371 million) based on the closing quoted share price on the Nairobi Stock Exchange.
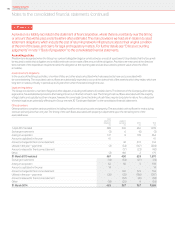
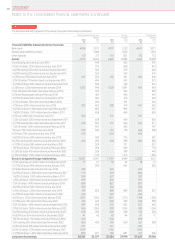
On 21 February 2014, the Group disposed of its 45% interest in Cellco Partnership which traded under the name Verizon Wireless. Consequently,
comparative information has been restated to reect the continuing operations of the business. Results from discontinued operations are disclosed
in note 7 “Discontinued operations” to the consolidated nancial statements. The summarised nancial information showing the Group’s share
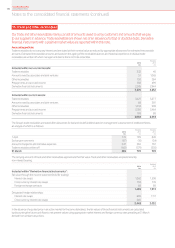
of equity accounted associates is set out below.
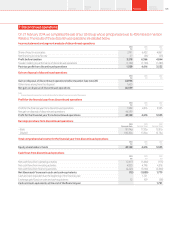
Cellco Partnership Other associates Total
2014
£m
2013
£m
2014
£m
2013
£m
2014
£m
2013
£m
Income statement and statement of comprehensive income
Revenue 22,122 48,827
Depreciation and amortisation (2,186) (5,145)
Interest income 13
Interest expense (38) (60)
Income tax (expense)/income (111) 29
Post-tax prot of loss from discontinuedoperations 7,092 14,272
Other comprehensive expense (2) –
Total comprehensive income 7,090 14,272
Statement of nancial position
Non-current assets –72,755
Current assets –9,764
Non-current liabilities –(6,328)
Current liabilities –(9,267)
Non-controlling interests –(1,366)
Equity shareholders’ funds –(65,558)
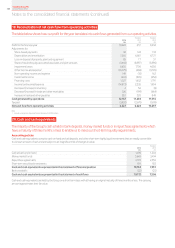
Statement of nancial position
Cash and cash equivalents within current assets –2,894
Non-current liabilities excluding trade and other payables and provisions –(5,034)
Current liabilities excluding trade and other payables and provisions –(3,208)
Summary
Investment in associates –38,373 272 262 272 38,635
Prot or loss from continuing operations – – 57 55 57 55
Post-tax prot from discontinuedoperations 3,191 6,422 – – 3,191 6,422
Other comprehensive expense (1) – – – (1) –
Total comprehensive income 3,190 6,422 57 55 3,247 6,477
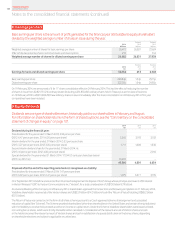
The Group received £4,828 million of dividends in the year to 31 March 2014 (2013: £4,798 million, 2012: £3,820 million) from Cellco Partnership.
Annual Report 2014 131Overview
Strategy
review Performance Governance Financials Additional
information