Vodafone 2014 Annual Report Download - page 42
Download and view the complete annual report
Please find page 42 of the 2014 Vodafone annual report below. You can navigate through the pages in the report by either clicking on the pages listed below, or by using the keyword search tool below to find specific information within the annual report.-
 1
1 -
2
-
3
-
4
-
5
-
6
-
7
-
8
-
9
-
10
-
11
-
12
-
13
-
14
-
15
-
16
-
17
-
18
-
19
-
20
-
21
-
22
-
23
-
24
-
25
-
26
-
27
-
28
-
29
-
30
-
31
-
 32
32 -
 33
33 -
 34
34 -
 35
35 -
 36
36 -
 37
37 -
 38
38 -
 39
39 -
 40
40 -
 41
41 -
 42
42 -
 43
43 -
 44
44 -
 45
45 -
 46
46 -
 47
47 -
 48
48 -
 49
49 -
 50
50 -
 51
51 -
 52
52 -
53
-
54
-
55
-
56
-
57
-
58
-
59
-
60
-
61
-
62
-
63
-
64
-
65
-
66
-
67
-
68
-
69
-
70
-
71
-
72
-
73
-
74
-
75
-
76
-
77
-
78
-
79
-
80
-
81
-
82
-
83
-
84
-
85
-
86
-
87
-
88
-
89
-
90
-
91
-
92
-
93
-
94
-
95
-
96
-
97
-
98
-
99
-
100
-
101
-
102
-
103
-
104
-
105
-
106
-
107
-
108
-
109
-
110
-
111
-
112
-
113
-
114
-
115
-
116
-
117
-
118
-
119
-
120
-
121
-
122
-
123
-
124
-
125
-
126
-
127
-
128
-
129
-
130
-
131
-
132
-
133
-
134
-
135
-
136
-
137
-
138
-
139
-
140
-
141
-
142
-
143
-
144
-
145
-
146
-
147
-
148
-
149
-
150
-
151
-
152
-
153
-
154
-
155
-
156
-
157
-
158
-
159
-
160
-
161
-
162
-
163
-
164
-
165
-
166
-
167
-
168
-
169
-
170
-
171
-
172
-
173
-
174
-
175
-
176
-
177
-
178
-
179
-
180
-
181
-
182
-
183
-
184
-
185
-
186
-
187
-
188
-
189
-
190
-
191
-
192
-
193
-
194
-
195
-
196
-
197
-
198
-
199
-
200
-
201
-
202
-
203
-
204
-
205
-
206
-
207
-
208
-
209
-
210
-
211
-
212
-
213
-
214
-
215
-
216
 |
 |

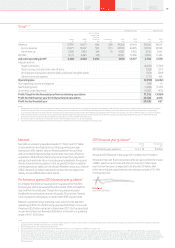
Europe
Germany
£m
Italy
£m
UK
£m
Spain
£m
Other Europe
£m
Eliminations
£m
Europe
£m
Restated
2013
£m
% change
£Organic
Year ended 31 March 2014
Revenue 8,272 4,312 6,427 3, 518 5,525 (57) 2 7,9 97 28,602 (2.1) (9.3)
Service revenue 7,7 39 3,863 6,095 3,230 5 ,10 4 (54) 25,977 26,501 (2.0) (9.1)
Other revenue 533 449 332 288 421 (3) 2,020 2 ,101 (3.9) (10.8)
EBITDA 2,698 1,536 1,418 787 1,736 –8 ,175 9,099 (10.2) (18.3)
Adjusted operating prot 918 726 187 181 676 –2,688 4,175 (35.6) (39.2)
EBITDA margin 32.6% 35.6% 22.1% 22.4% 31.4% 29.2% 31.8%
Revenue decreased 2.1%, including a 2.5 percentage point favourable
impact from foreign exchange rate movements and a 4.7 percentage
point positive impact from M&A and other activity. On an organic basis
service revenue declined 9.1%*, driven by challenging macroeconomic
conditions in many markets, increased competition and the
impact of MTR cuts, partially offset by continued growth of mobile
in-bundle revenue.
EBITDA decreased 10.2%, including a 2.5 percentage point favourable
impact from foreign exchange rate movements and a 5.6 percentage
point positive impact from M&A and other activity. On an organic basis
EBITDA decreased 18.3%*, resulting from a reduction in service revenue
in most markets and higher customer investment, partially offset
by efciency in operating costs.
Organic
change
%
Other
activity1
pps
Foreign
exchange
pps
Reported
change
%
Revenue – Europe (9.3) 4.7 2.5 (2.1)
Service revenue
Germany (6.2) 9.0 3.6 6.4
Italy (17.1) 2.2 3 .1 (11.8)
UK (4.4) 31.9 –2 7. 5
Spain (13.4) (0.7) 3 .1 (11.0)
Other Europe (7.1) (17.5) 1.8 (22.8)
Europe (9.1) 4.6 2.5 (2.0)
EBITDA
Germany (18.2) 10.2 3.3 (4.7)
Italy (24.9) 2.2 2.8 (19.9)
UK (9.8) 26.9 0.1 17. 2
Spain (23.9) (1.8) 2.8 (22.9)
Other Europe (14.0) (6.2) 2 .1 (18 .1)
Europe (18.3) 5.6 2.5 (10.2)
Adjusted operating prot
Germany (36.0) (1.1) 2.6 (34.5)
Italy (41.6) 1.1 2.4 (38.1)
UK (49.3) 11. 0 –(38.3)
Spain (56.4) (2.5) 1.9 (57.0)
Other Europe (30.2) 4.8 2.4 (23.0)
Europe (39.2) 1.3 2.3 (35.6)
Note:
1 “Other activity” includes the impact of M&A activity and the revision to intra-group roaming charges from
1 April 2013. Refer to “Organic growth” on page 202 for further detail.
This section presents our operating performance, providing commentary on how the revenue and the EBITDA
performance of the Group and its operating segments within the Europe and AMAP regions, together with
Common Functions, have developed over the last year. See pages 171 to 175 for commentary on the 2013
nancial year. Consistent with the nancial highlights on page 3, this section contains nancial information
on both a management and statutory basis. The discussion of our revenues, EBITDA and adjusted operating
prot by segment is performed under the management basis as this is assessed as being the most insightful
presentation and is how the Group’s operating performance is reviewed internally by management. The discussion
of items of prot and losses under adjusted operating prot, being primarily income tax, net nance costs and
non-operating items, is performed on a statutory basis.
Vodafone Group Plc
Annual Report 201440
Operating results