Vodafone 2014 Annual Report Download - page 76
Download and view the complete annual report
Please find page 76 of the 2014 Vodafone annual report below. You can navigate through the pages in the report by either clicking on the pages listed below, or by using the keyword search tool below to find specific information within the annual report.-
 1
1 -
2
-
3
-
4
-
5
-
6
-
7
-
8
-
9
-
10
-
11
-
12
-
13
-
14
-
15
-
16
-
17
-
18
-
19
-
20
-
21
-
22
-
23
-
24
-
25
-
26
-
27
-
28
-
29
-
30
-
31
-
32
-
33
-
34
-
35
-
36
-
37
-
38
-
39
-
40
-
41
-
42
-
43
-
44
-
45
-
46
-
47
-
48
-
49
-
50
-
51
-
52
-
53
-
54
-
55
-
56
-
57
-
58
-
59
-
60
-
61
-
62
-
63
-
64
-
65
-
 66
66 -
 67
67 -
 68
68 -
 69
69 -
 70
70 -
 71
71 -
 72
72 -
 73
73 -
 74
74 -
 75
75 -
 76
76 -
 77
77 -
 78
78 -
 79
79 -
 80
80 -
 81
81 -
 82
82 -
 83
83 -
 84
84 -
 85
85 -
 86
86 -
87
-
88
-
89
-
90
-
91
-
92
-
93
-
94
-
95
-
96
-
97
-
98
-
99
-
100
-
101
-
102
-
103
-
104
-
105
-
106
-
107
-
108
-
109
-
110
-
111
-
112
-
113
-
114
-
115
-
116
-
117
-
118
-
119
-
120
-
121
-
122
-
123
-
124
-
125
-
126
-
127
-
128
-
129
-
130
-
131
-
132
-
133
-
134
-
135
-
136
-
137
-
138
-
139
-
140
-
141
-
142
-
143
-
144
-
145
-
146
-
147
-
148
-
149
-
150
-
151
-
152
-
153
-
154
-
155
-
156
-
157
-
158
-
159
-
160
-
161
-
162
-
163
-
164
-
165
-
166
-
167
-
168
-
169
-
170
-
171
-
172
-
173
-
174
-
175
-
176
-
177
-
178
-
179
-
180
-
181
-
182
-
183
-
184
-
185
-
186
-
187
-
188
-
189
-
190
-
191
-
192
-
193
-
194
-
195
-
196
-
197
-
198
-
199
-
200
-
201
-
202
-
203
-
204
-
205
-
206
-
207
-
208
-
209
-
210
-
211
-
212
-
213
-
214
-
215
-
216
 |
 |

Remuneration policy (continued)
Notes to the remuneration policy table
Existing arrangements
We will honour existing awards to executive directors, and incentives, benets and contractual arrangements made to individuals prior to their
promotion to the Board. This will last until the existing incentives vest (or lapse) or the benets or contractual arrangements no longer apply.
Long-Term Incentive (‘GLTI’)
When referring to our long-term incentive awards we use the nancial year end in which the award was made. For example, the ‘2013 award’
was made in the nancial year ending 31 March 2013. The awards are usually made in the rst half of the nancial year (the 2013 award was made
in July 2012).
The extent to which awards vest depends on two performance conditions:
a underlying operational performance as measured by adjusted free cash ow; and
a relative Total Shareholder Return (‘TSR’) against a peer group median.
Adjusted free cash ow
The free cash ow performance is based on the cumulative adjusted free cash ow gure over the performance period. The detailed targets and
the denition ofadjusted free cash ow are determined each year as appropriate. The target adjusted free cash ow level is set by reference to our
long-range plan and market expectations. We consider the targets to be critical to the Company’s long-term success and its ability to maximise
shareholder value, and to be in line with the strategic goals of the Company. The Remuneration Committee sets these targets to be sufciently
demanding with signicant stretch where only outstanding performance will be rewarded with a maximum payout.
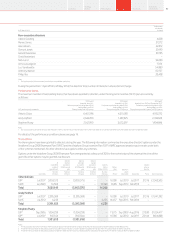
The cumulative adjusted free cash ow vesting levels as a percentage of target are shown in the table below (with linear interpolation between points):
Performance Vesting percentage
Below threshold 0%
Threshold 50%
Target 100%
Maximum 125%
TSR outperformance of a peer group median
We have a limited number of appropriate peers and this makes the measurement of a relative ranking system volatile. As such, the outperformance
of the median of a peer group is felt to be the most appropriate TSR measure. The peer group for the performance condition is reviewed each year
and amended as appropriate.
The relative TSR position determines the performance multiplier. Thiswill beapplied to the adjusted free cash ow vesting percentage. There will
be no multiplier until TSR performance exceeds median. Above median, thefollowing table will apply (with linear interpolation between points):
Multiplier
Median No increase
Percentage outperformance of the peer group median equivalent to 65th percentile 1.5 times
Percentage outperformance of the peer group median equivalent to 80th percentile 2.0 times
In order to determine the percentages for the equivalent outperformance levels above median, the Remuneration Committee seeks independent
external advice.
Combined vesting matrix
The combination of the two performance measures gives a combined vesting matrix as follows (with linear interpolation between points):
TSR outperformance
Adjusted free cash ow measure
Up to
Median
65th percentile
equivalent
80th percentile
equivalent
Below threshold 0% 0% 0%
Threshold 50% 75% 100%
Target 100% 150% 200%
Maximum 125% 187.5% 250%
The combined vesting percentages are applied to the target number of shares granted.
Outstanding awards
For the awards made in the 2013 and 2014 nancial years (vesting in July 2015 and June 2016 respectively) the award structure is as set out
above, except that the maximum vesting percentage for cumulative adjusted free cash ow was 150% leading to an overall maximum of 300%
of target award.
Remuneration policy for other employees
While our remuneration policy follows the same fundamental principles across the Group, packages offered to employees reect differences
in market practice in the different countries, role and seniority.
For example, the remuneration package elements for our executive directors are essentially the same as for the other Executive Committee
members, with some small differences, for example higher levels of share awards. The remuneration for the next level of management, our senior
leadership team, again follows the same principles but with differences such as local and individual performance aspects in the annual bonus targets
and performance share awards. They also receive lower levels of share awards which are partly delivered in restricted shares.
Vodafone Group Plc
Annual Report 201474
Directors’ remuneration (continued)