Vodafone 2014 Annual Report Download - page 41
Download and view the complete annual report
Please find page 41 of the 2014 Vodafone annual report below. You can navigate through the pages in the report by either clicking on the pages listed below, or by using the keyword search tool below to find specific information within the annual report.-
 1
1 -
2
-
3
-
4
-
5
-
6
-
7
-
8
-
9
-
10
-
11
-
12
-
13
-
14
-
15
-
16
-
17
-
18
-
19
-
20
-
21
-
22
-
23
-
24
-
25
-
26
-
27
-
28
-
29
-
30
-
 31
31 -
 32
32 -
 33
33 -
 34
34 -
 35
35 -
 36
36 -
 37
37 -
 38
38 -
 39
39 -
 40
40 -
 41
41 -
 42
42 -
 43
43 -
 44
44 -
 45
45 -
 46
46 -
 47
47 -
 48
48 -
 49
49 -
 50
50 -
 51
51 -
52
-
53
-
54
-
55
-
56
-
57
-
58
-
59
-
60
-
61
-
62
-
63
-
64
-
65
-
66
-
67
-
68
-
69
-
70
-
71
-
72
-
73
-
74
-
75
-
76
-
77
-
78
-
79
-
80
-
81
-
82
-
83
-
84
-
85
-
86
-
87
-
88
-
89
-
90
-
91
-
92
-
93
-
94
-
95
-
96
-
97
-
98
-
99
-
100
-
101
-
102
-
103
-
104
-
105
-
106
-
107
-
108
-
109
-
110
-
111
-
112
-
113
-
114
-
115
-
116
-
117
-
118
-
119
-
120
-
121
-
122
-
123
-
124
-
125
-
126
-
127
-
128
-
129
-
130
-
131
-
132
-
133
-
134
-
135
-
136
-
137
-
138
-
139
-
140
-
141
-
142
-
143
-
144
-
145
-
146
-
147
-
148
-
149
-
150
-
151
-
152
-
153
-
154
-
155
-
156
-
157
-
158
-
159
-
160
-
161
-
162
-
163
-
164
-
165
-
166
-
167
-
168
-
169
-
170
-
171
-
172
-
173
-
174
-
175
-
176
-
177
-
178
-
179
-
180
-
181
-
182
-
183
-
184
-
185
-
186
-
187
-
188
-
189
-
190
-
191
-
192
-
193
-
194
-
195
-
196
-
197
-
198
-
199
-
200
-
201
-
202
-
203
-
204
-
205
-
206
-
207
-
208
-
209
-
210
-
211
-
212
-
213
-
214
-
215
-
216
 |
 |

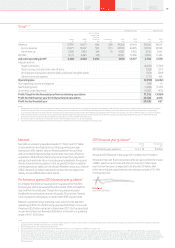
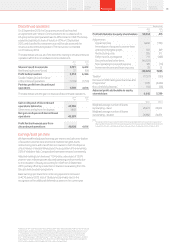
Group1,2,3
Management basis1Statutory basis1
Europe
£m
AMAP
£m
Non-Controlled
Interests and
Common
Functions4
£m
Eliminations
£m
2014
£m
2013
£m
2014
£m
2013
£m
Revenue 27, 997 14,971 686 (38) 43 ,616 44,445 38,346 38,041
Service revenue 25,977 13,087 502 (37) 39,529 40,495 35,190 34,999
Other revenue 2,020 1,884 184 (1) 4,087 3,950 3,156 3,042
EBITDA28 ,175 4,680 (24) –12, 831 13,566 11,084 11,466
Adjusted operating prot22,688 2,092 3,094 –7,874 12,577 4,310 5,590
Adjustments for:
Impairment losses (6,600) (7,700)
Restructuring costs and other one-off items (355) (311)
Amortisation of acquired customer bases and brand intangible assets (551) (249)
Other income and expense (717) 468
Operating loss (3,913) (2,202)
Non-operating income and expense (149) 10
Net nancing costs (1,208) (1,291)
Income tax credit/(expense) 16,582 (476)
Prot/(loss) for the nancial year from continuing operations 11,312 (3,959)
Prot for the nancial year from discontinued operations 48,108 4,616
Prot for the nancial year 59,420 657
Notes:
1 Management basis amounts and growth rates are calculated consistent with how the business is managed and operated, and include the results of the Group’s joint ventures, Vodafone Italy, Vodafone Hutchison Australia,
Vodafone Fiji and Indus Towers, on a proportionate basis, including the prot contribution from Verizon Wireless to 2 September 2013. Statutory basis includes the results of the Group’s joint ventures using the equity
accounting basis rather than on a proportionate consolidation basis, with the prot contribution from Verizon Wireless being classied within discontinued operations. See “Non-GAAP information” on page 201 for details.
2 All amounts are presented on the Group’s revised segment basis. EBITDA and adjusted operating prot have been restated to exclude restructuring costs. Adjusted operating prot has also been redened to exclude
amortisation of customer base and brand intangible assets. See page 201 for “Non-GAAP nancial information”.
3 2014 results reect average foreign exchange rates of £1:€1.19 and £1:US$1.59 (2013: £1:€1.23 and £1:US$1.58).
4 Common Functions primarily represent the results of the partner markets and the net result of unallocated central Group costs.
Net debt
Net debt on a statutory basis decreased £11.7 billion to £13.7 billion
as proceeds from the disposal of our US group, whose principal
asset was its 45% stake in Verizon Wireless, positive free cash ow
and favourable foreign exchange movements more than offset the
acquisition of Kabel Deutschland, licences and spectrum payments
and equity shareholder returns including equity dividends, the special
distribution and share buybacks. In Q4, we paid £2.4 billion in relation
to the expected tax liability for the Verizon Wireless transaction, of which
US$3.3 billion (£2.0 billion) was paid to Verizon. We now expect this
liability to total US$3.6 billion (£2.2 billion).
Performance against 2014 nancial year guidance2
On 2 September 2013 we issued pro forma guidance for the 2014
nancial year, which excluded VZW and included 100% of Vodafone
Italy, both for the whole year. This pro forma guidance included
Vodafone’s remaining joint ventures (Australia, Fiji and Indus Towers),
on an equity accounting basis, consistent with IFRS requirements.
Based on guidance foreign exchange rates, our pro forma adjusted
operating prot for the 2014 nancial year was £4.9 billion2, in line with
the around £5.0 billion range set in September 2013. On the same basis
our pro forma free cash ow was £4.8 billion2, in line with our guidance
range of £4.5–£5.0 billion.
2015 nancial year guidance3
EBITDA
£bn
Free cash ow
£bn
2015 nancial year guidance 11.4–11.9 Positive
We expect EBITDA to be in the range of £11.4 billion to £11.9 billion.
We expect free cash ow to be positive after all capex, before the impact
of M&A, spectrum purchases and restructuring costs. Total capex
over the next two years is expected to be around £19 billion, after
which we anticipate capital intensity normalising to a level of 13–14%
of annual revenue.
Nick Read
Chief Financial Ofcer
Annual Report 2014 39Overview
Strategy
review Performance Governance Financials
Additional
information
Notes:
* All amounts in this document marked with an “*” represent organic growth which presents performance on a comparable basis, both in terms of merger and acquisition activity and movements in foreign exchange rates.
See page 202 “Non-GAAP nancial information” for further details.
1 Please see page 201 for “Non-GAAP nancial information”.
2 Guidance foreign exchange rates for the year ended 31 March 2014 were £1:€1.17, £1=US$1.52, £1:INR 84.9 and £1:ZAR 14.3.
3 We have based guidance for the 2015 nancial year on our current assessment of the global macroeconomic outlook and assume foreign exchange rates of £1:€1.21, £1:INR 105.8 and £1:ZAR 18.4. It excludes the impact
of licences and spectrum purchases, material one-off tax-related payments, restructuring costs and any fundamental structural change to the Eurozone. It also assumes no material change to the current structure of the
Group. Actual foreign exchange rates may vary from the foreign exchange rate assumptions used. A 1% change in the euro to sterling exchange rate would impact EBITDA by £60 million and have no material impact on free
cash ow. A 1% change in the Indian rupee to sterling exchange rate would impact EBITDA by £10 million and free cash ow by £5 million. A 1% change in the South African Rand to sterling exchange rate would impact EBITDA
by £15 million and free cash ow by £5 million. Guidance for the year ending 31 March 2015 includes the results of Vodafone’s remaining joint ventures (Australia, Fiji and Indus Towers) on an equity basis, consistent with
IFRS requirements.