Vodafone 2014 Annual Report Download - page 44
Download and view the complete annual report
Please find page 44 of the 2014 Vodafone annual report below. You can navigate through the pages in the report by either clicking on the pages listed below, or by using the keyword search tool below to find specific information within the annual report.-
 1
1 -
2
-
3
-
4
-
5
-
6
-
7
-
8
-
9
-
10
-
11
-
12
-
13
-
14
-
15
-
16
-
17
-
18
-
19
-
20
-
21
-
22
-
23
-
24
-
25
-
26
-
27
-
28
-
29
-
30
-
31
-
32
-
33
-
 34
34 -
 35
35 -
 36
36 -
 37
37 -
 38
38 -
 39
39 -
 40
40 -
 41
41 -
 42
42 -
 43
43 -
 44
44 -
 45
45 -
 46
46 -
 47
47 -
 48
48 -
 49
49 -
 50
50 -
 51
51 -
 52
52 -
 53
53 -
 54
54 -
55
-
56
-
57
-
58
-
59
-
60
-
61
-
62
-
63
-
64
-
65
-
66
-
67
-
68
-
69
-
70
-
71
-
72
-
73
-
74
-
75
-
76
-
77
-
78
-
79
-
80
-
81
-
82
-
83
-
84
-
85
-
86
-
87
-
88
-
89
-
90
-
91
-
92
-
93
-
94
-
95
-
96
-
97
-
98
-
99
-
100
-
101
-
102
-
103
-
104
-
105
-
106
-
107
-
108
-
109
-
110
-
111
-
112
-
113
-
114
-
115
-
116
-
117
-
118
-
119
-
120
-
121
-
122
-
123
-
124
-
125
-
126
-
127
-
128
-
129
-
130
-
131
-
132
-
133
-
134
-
135
-
136
-
137
-
138
-
139
-
140
-
141
-
142
-
143
-
144
-
145
-
146
-
147
-
148
-
149
-
150
-
151
-
152
-
153
-
154
-
155
-
156
-
157
-
158
-
159
-
160
-
161
-
162
-
163
-
164
-
165
-
166
-
167
-
168
-
169
-
170
-
171
-
172
-
173
-
174
-
175
-
176
-
177
-
178
-
179
-
180
-
181
-
182
-
183
-
184
-
185
-
186
-
187
-
188
-
189
-
190
-
191
-
192
-
193
-
194
-
195
-
196
-
197
-
198
-
199
-
200
-
201
-
202
-
203
-
204
-
205
-
206
-
207
-
208
-
209
-
210
-
211
-
212
-
213
-
214
-
215
-
216
 |
 |
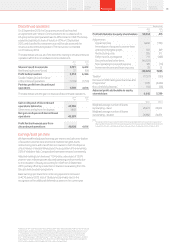
Africa, Middle East and Asia Pacic
India
£m
Vodacom
£m
Other AMAP
£m
Eliminations
£m
AMAP
£m
Restated
2013
£m
% change
£Organic
Year ended 31 March 2014
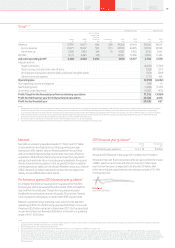
Revenue 4,394 4,718 5,860 (1) 14,971 15,413 (2.9) 8.4
Service revenue 3,927 3,866 5,295 (1) 13,087 13,729 (4.7) 6 .1
Other revenue 467 852 565 –1,884 1,684 11. 9 27. 4
EBITDA 1,397 1,716 1,567 –4,680 4,532 3.3 16.2
Adjusted operating prot 354 1,228 510 –2,092 1,893 10.5 28.6
EBITDA margin 31.8% 36.4% 26.7% 31.3% 29.4%
Revenue declined 2.9% mainly as a result of a 12.0 percentage point
adverse impact from foreign exchange rate movements, particularly
with regard to the Indian rupee, the South African rand and the
Turkish lira. On an organic basis service revenue grew 6.1%*, driven
by a higher customer base, increased customer usage and successful
pricing strategies, partially offset by the impact of MTR reductions and
a general weakening in macroeconomic conditions in certain countries.
Growth was led by strong performances in India, Turkey, Qatar and
Ghana and robust performances in Vodacom and Egypt, partly offset
by service revenue declines in Australia and New Zealand.
EBITDA increased 3.3%, including a 13.9 percentage point adverse
impact from foreign exchange rate movements. On an organic basis,
EBITDA grew 16.2%*, driven primarily by strong growth in India, Turkey,
Australia, Qatar and Ghana as well as improved contributions from Egypt
and Vodacom.
Organic
change
%
Other
activity1
pps
Foreign
exchange
pps
Reported
change
%
Revenue – AMAP 8.4 0.7 (12.0) (2.9)
Service revenue
India 13.0 –(11.7) 1.3
Vodacom 4 .1 (2.8) (13.7) (12.4)
Other AMAP 2.8 4.0 (9.4) (2.6)
AMAP 6.1 0.7 (11.5) (4.7)
EBITDA
India 26.4 –(13.7) 12.7
Vodacom 6.6 0.2 (16.1) (9.3)
Other AMAP 19.3 3.2 (10.7) 11. 8
AMAP 16.2 1.0 (13.9) 3.3
Adjusted operating prot
India 83.3 –(23.1) 60.2
Vodacom 8.9 0.3 (17.0) (7.8)
Other AMAP 66.5 (2.6) (13.9) 50.0
AMAP 28.6 (0.2) (17.9) 10.5
Notes:
1 “Other activity” includes the impact of M&A activity and the revision to intra-group roaming charges from
1 April 2013. Refer to “Organic growth” on page 202 for further detail.
India
Service revenue increased 13.0%*, driven by continued customer
growth and data usage as well as improved voice pricing.
Mobile customers increased by 14.2 million during the year, yielding
a closing customer base of 166.6 million at 31 March 2014.
Data usage grew 125% during the year, primarily resulting from a 39%
increase in mobile internet users and a 67% increase in usage per
customer. At 31 March 2014 active data customers totalled 52 million
including seven million 3G customers.
We progressively rolled out M-Pesa across India over the year, reaching
nationwide coverage by March 2014.
EBITDA grew 26.4%*, with a 3.3* percentage point increase in EBITDA
margin, driven by the higher revenue and the resulting economies
of scale on costs.
In February, Vodafone India successfully bid for additional spectrum
in 11 telecom circles in the Indian Government’s 900MHz and 1800MHz
spectrum auction, enabling the company to provide customers with
enhanced mobile voice and data services across the country. Of the
total £1.9 billion cost of these spectrum licences, £0.5 billion was paid
during the nancial year with the remainder payable in instalments
starting in 2017.
Vodacom
Service revenue grew 4.1%*, driven by strong growth in Vodacom’s
mobile operations outside South Africa. In South Africa, organic service
revenue increased 0.3%*, despite the adverse impact of an MTR cut,
due to the strong growth in data revenues of 23.5%*, driven by higher
smartphone penetration and the strong demand for prepaid bundles.
Vodacom’s mobile operations outside South Africa delivered service
revenue growth of 18.9%* mainly from continued customer base
growth. M-Pesa continued to perform well and is now operational in all
of the Vodacom mobile operations outside of South Africa, with over
4.4 million customers actively using the service.
EBITDA increased 6.6%*, driven by revenue growth, optimisation
in customer investment and efciencies in South Africa operating
costs. The EBITDA margin decline of 0.3* percentage points is the
resultof higher sales of lower margin handsets.
On 14 April 2014, Vodacom announced the acquisition of the Vodacom
customer base from Nashua, a mobile cellular provider for South
African mobile network operators, subject to the approval of the
Competition Authority.
On 19 May 2014 Vodacom announced that it had reached
an agreement with the shareholders of Neotel Proprietary Limited
(‘Neotel’), the second largest provider of xed telecommunications
services for both enterprise and consumers in South Africa, to acquire
100% of the issued share capital in, and shareholder loans against,
Neotel for a total cash consideration of ZAR 7.0 billion (£0.4 billion).
The transaction remains subject to the fullment of a number
of conditions precedent including applicable regulatory approvals
andis expected to close before the end of the nancial year.
Vodafone Group Plc
Annual Report 201442
Operating results (continued)