Vodafone 2014 Annual Report Download - page 206
Download and view the complete annual report
Please find page 206 of the 2014 Vodafone annual report below. You can navigate through the pages in the report by either clicking on the pages listed below, or by using the keyword search tool below to find specific information within the annual report.-
 1
1 -
2
-
3
-
4
-
5
-
6
-
7
-
8
-
9
-
10
-
11
-
12
-
13
-
14
-
15
-
16
-
17
-
18
-
19
-
20
-
21
-
22
-
23
-
24
-
25
-
26
-
27
-
28
-
29
-
30
-
31
-
32
-
33
-
34
-
35
-
36
-
37
-
38
-
39
-
40
-
41
-
42
-
43
-
44
-
45
-
46
-
47
-
48
-
49
-
50
-
51
-
52
-
53
-
54
-
55
-
56
-
57
-
58
-
59
-
60
-
61
-
62
-
63
-
64
-
65
-
66
-
67
-
68
-
69
-
70
-
71
-
72
-
73
-
74
-
75
-
76
-
77
-
78
-
79
-
80
-
81
-
82
-
83
-
84
-
85
-
86
-
87
-
88
-
89
-
90
-
91
-
92
-
93
-
94
-
95
-
96
-
97
-
98
-
99
-
100
-
101
-
102
-
103
-
104
-
105
-
106
-
107
-
108
-
109
-
110
-
111
-
112
-
113
-
114
-
115
-
116
-
117
-
118
-
119
-
120
-
121
-
122
-
123
-
124
-
125
-
126
-
127
-
128
-
129
-
130
-
131
-
132
-
133
-
134
-
135
-
136
-
137
-
138
-
139
-
140
-
141
-
142
-
143
-
144
-
145
-
146
-
147
-
148
-
149
-
150
-
151
-
152
-
153
-
154
-
155
-
156
-
157
-
158
-
159
-
160
-
161
-
162
-
163
-
164
-
165
-
166
-
167
-
168
-
169
-
170
-
171
-
172
-
173
-
174
-
175
-
176
-
177
-
178
-
179
-
180
-
181
-
182
-
183
-
184
-
185
-
186
-
187
-
188
-
189
-
190
-
191
-
192
-
193
-
194
-
195
-
 196
196 -
 197
197 -
 198
198 -
 199
199 -
 200
200 -
 201
201 -
 202
202 -
 203
203 -
 204
204 -
 205
205 -
 206
206 -
 207
207 -
 208
208 -
 209
209 -
 210
210 -
 211
211 -
 212
212 -
 213
213 -
 214
214 -
 215
215 -
 216
216
 |
 |

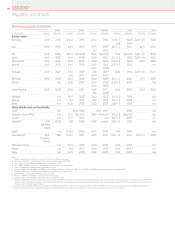
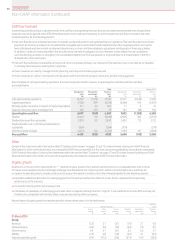
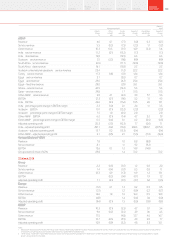
Non-GAAP information (continued)
Management basis1
Statutory
basis1
Organic
change
%
Other
activity2
pps
Foreign
exchange
pps
Reported
change
%
Presentation
adjustments
pps
Reported
change
%
EBITDA 16.2 1.0 (13.9) 3.3 (4.5) (1.2)
India – EBITDA 26.4 –(13.7) 12.7 (5.1) 7.6
India – percentage point change in EBITDA margin 3.3 (0.1) (0.1) 3.1 (1.3) 1.8
Vodacom – EBITDA 6.6 0.2 (16.1) (9.3) –(9.3)
Vodacom – percentage point change in EBITDA margin (0.3) 0.8 (0.4) 0.1 –0.1
Other AMAP – EBITDA 19.3 3.2 (10.7) 11.8 (8.3) 3.5
Other AMAP – percentage point change in EBITDA margin 3.1 (0.2) –2.9 (3.2) (0.3)
Australia – percentage point change in EBITDA margin 14.8 –(0.2) 14.6 (14.6) –
Adjusted operating prot 28.6 (0.2) (17.9) 10.5 2.4 12.9
India – adjusted operating prot 83.3 –(23.1) 60.2 46.1 106.3
Vodacom – adjusted operating prot 8.9 0.3 (17.0) (7.8) –(7.8)
Other AMAP – adjusted operating prot 66.5 (2.6) (13.9) 50.0 17.2 67.2
31 March 2013
Group
Revenue (1.4) 2.8 (5.6) (4.2) 2.2 (2.0)
Service revenue (1.9) 2.6 (5.6) (4.9) 2.8 (2.1)
Other revenue 4.0 5.3 (6.3) 3.0 (4.1) (1.1)
EBITDA (1.9) 0.6 (5.8) (7.1) 4.8 (2.3)
Adjusted operating prot 9.5 (1.5) (3.5) 4.5 2.1 6.6
Europe
Revenue (5.5) 4.4 (4.6) (5.7) 2.3 (3.4)
Service revenue (5.8) 4.5 (4.6) (5.9) 2.8 (3.1)
Other revenue (1.3) 2.4 (4.3) (3.2) (3.0) (6.2)
Germany – service revenue 0.5 (0.1) (5.5) (5.1) –(5.1)
Germany – mobile service revenue 1.3 (0.2) (5.5) (4.4) –(4.4)
Germany – data revenue 13.6 –(6.0) 7.6 –7.6
Germany – enterprise revenue 3.0 –(5.6) (2.6) –(2.6)
Italy – service revenue (12.8) (0.1) (4.9) (17.8) 17.8 –
Italy – data revenue 4.4 –(5.7) (1.3) 1.3 –
Italy – xed line revenue (6.8) –(5.1) (11.9) 11.9 –
UK – service revenue (4.0) (0.3) –(4.3) –(4.3)
UK – data revenue 4.2 – – 4.2 –4.2
Spain – service revenue (11.5) (0.2) (5.0) (16.7) –(16.7)
Spain – data revenue 16.5 –(6.1) 10.4 –10.4
Spain – xed line revenue (2.9) –(5.0) (7.9) –(7.9)
Netherlands – service revenue (2.7) (0.2) (5.4) (8.3) –(8.3)
Greece – service revenue (13.4) (0.4) (5.0) (18.8) –(18.8)
Portugal – service revenue (8.2) (0.2) (5.2) (13.6) –(13.6)
Other Europe – service revenue growth (5.2) 22.4 (6.9) 10.3 –10.3
EBITDA (8.1) 1.8 (4.7) (11.0) 4.3 (6.7)
Germany – EBITDA (1.7) 0.2 (5.2) (6.7) –(6.7)
Germany – percentage point change in EBITDA margin (1.0) 0.1 –(0.9) –(0.9)
Italy – EBITDA (19.3) –(4.7) (24.0) 24.0 –
Italy – percentage point change in EBITDA margin (4.3) – – (4.3) 4.2 (0.1)
UK – EBITDA (6.8) 0.4 (0.1) (6.5) –(6.5)
UK – percentage point change in EBITDA margin (0.5) – – (0.5) –(0.5)
Spain – EBITDA (9.8) (0.5) (5.3) (15.6) –(15.6)
Spain – percentage point change in EBITDA margin 0.9 (0.1) 0.0 0.8 –0.8
Other Europe – EBITDA (3.7) 8.1 (6.3) (1.9) –(1.9)
Other Europe – percentage point change in EBITDA margin 0.1 (3.6) (0.1) (3.6) –(3.6)
Adjusted operating prot (15.8) (1.1) (4.5) (21.4) 1.6 (19.8)
Germany – adjusted operating prot (5.5) 0.3 (5.0) (10.2) –(10.2)
Italy – adjusted operating prot (28.5) –(4.2) (32.7) (0.2) (32.9)
UK – adjusted operating prot (26.3) 0.9 –(25.4) –(25.4)
Spain – adjusted operating prot (21.8) (1.0) (5.0) (27.8) –(27.8)
Other Europe – adjusted operating prot (2.0) (6.1) (5.7) (13.8) 0.1 (13.7)
Vodafone Group Plc
Annual Report 2014204