Vodafone 2014 Annual Report Download - page 18
Download and view the complete annual report
Please find page 18 of the 2014 Vodafone annual report below. You can navigate through the pages in the report by either clicking on the pages listed below, or by using the keyword search tool below to find specific information within the annual report.-
 1
1 -
2
-
3
-
4
-
5
-
6
-
7
-
 8
8 -
 9
9 -
 10
10 -
 11
11 -
 12
12 -
 13
13 -
 14
14 -
 15
15 -
 16
16 -
 17
17 -
 18
18 -
 19
19 -
 20
20 -
 21
21 -
 22
22 -
 23
23 -
 24
24 -
 25
25 -
 26
26 -
 27
27 -
 28
28 -
29
-
30
-
31
-
32
-
33
-
34
-
35
-
36
-
37
-
38
-
39
-
40
-
41
-
42
-
43
-
44
-
45
-
46
-
47
-
48
-
49
-
50
-
51
-
52
-
53
-
54
-
55
-
56
-
57
-
58
-
59
-
60
-
61
-
62
-
63
-
64
-
65
-
66
-
67
-
68
-
69
-
70
-
71
-
72
-
73
-
74
-
75
-
76
-
77
-
78
-
79
-
80
-
81
-
82
-
83
-
84
-
85
-
86
-
87
-
88
-
89
-
90
-
91
-
92
-
93
-
94
-
95
-
96
-
97
-
98
-
99
-
100
-
101
-
102
-
103
-
104
-
105
-
106
-
107
-
108
-
109
-
110
-
111
-
112
-
113
-
114
-
115
-
116
-
117
-
118
-
119
-
120
-
121
-
122
-
123
-
124
-
125
-
126
-
127
-
128
-
129
-
130
-
131
-
132
-
133
-
134
-
135
-
136
-
137
-
138
-
139
-
140
-
141
-
142
-
143
-
144
-
145
-
146
-
147
-
148
-
149
-
150
-
151
-
152
-
153
-
154
-
155
-
156
-
157
-
158
-
159
-
160
-
161
-
162
-
163
-
164
-
165
-
166
-
167
-
168
-
169
-
170
-
171
-
172
-
173
-
174
-
175
-
176
-
177
-
178
-
179
-
180
-
181
-
182
-
183
-
184
-
185
-
186
-
187
-
188
-
189
-
190
-
191
-
192
-
193
-
194
-
195
-
196
-
197
-
198
-
199
-
200
-
201
-
202
-
203
-
204
-
205
-
206
-
207
-
208
-
209
-
210
-
211
-
212
-
213
-
214
-
215
-
216
 |
 |

Key performance indicators
Monitoring our progress
and performance
We track our performance against 12 key nancial, operational and
commercial metrics which we judge to be the best indicators of how we are
doing. The pressures we have faced in Europe are reected in the decline in
service revenue and EBITDA margin and the loss of market position. Despite
this we met our nancial guidance and increased our dividend per share and
we have made clear progress in our operational and commercial KPIs.
Growth in the top line demonstrates our
ability to grow our customer base and
stabilise or increase ARPU. It also helps
to maintain margins. We aim to return
to service revenue growth.
Growth in our EBITDA margin magnies
the impact of revenue growth on the
protability of our business. We expected
this year’s margin to be lower than
lastyear’s.
AOP includes the impact of depreciation
and amortisation and includes the results
of our non-controlling interests.
We gave guidance of around £5 billion for
the year on a pro forma basis, see page 39.
Maintaining a high level of cash
generation is key to delivering strong
shareholder returns.
We gave guidance of £4.5–£5 billion for
the year on a pro forma basis, see page 39.
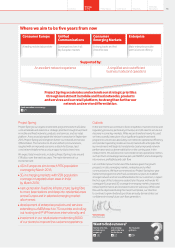
Our strategic push towards bundling
voice, text and data allows us to defend
our revenue base from substitution,
and to monetise future data demand
growth. We aim to increase this proportion
eachyear.
Smartphones are key to giving our
customers access to data; the more our
customers have them, the bigger our data
opportunity becomes. We aim to increase
penetration to over 50% by 2015.
More work to do
Achieved
Achieved
Achieved
Achieved
201220132014
£6.1bn
£5.6bn
£4.4bn
201220132014
Data not available
51%
58%
201220132014
28%
38%
45%
201220132014
+1.5%*
-1.9%*
-4.3%*
201220132014
31.2%
30.5%
29.4%
201220132014
£11.9bn
£12.6bn
£7.9bn
More work to do
Organic service revenue growth
We were unable to grow our service revenue
this year, as the competitive, regulatory and
macroeconomic pressures in Europe seen last
year continued.
As expected, competitive, regulatory and
macroeconomic pressures in Europe
offset improvements in AMAP and our
margin declined.
The fall in AOP reects the disposal of Verizon
Wireless during the year, the decline in EBITDA
and higher depreciation and amortisation.
On a guidance basis, AOP was £4.9 billion
(seepage 39 for details).
Free cash ow fell in the year as a result
of exchange rate movements in some of our
emerging markets and lower EBITDA.
On a guidance basis, free cash ow was
£4.8 billion (see page 39 for details).
We continue to make great progress in this
area, helped by the rapid adoption of our
Vodafone Red plans (see page 22).
Our customers increasingly want
smartphones as data becomes more and
more crucial to everyday life. We are on course
to meet our target of half of our European
customers using smartphones by next year.
See pages 22 and 23 for more information.
EBITDA margin1
Adjusted operating prot (‘AOP’)1
Free cash ow
% of European mobile service revenue in-bundle2
Smartphone penetration (March 2014, Europe2)
Vodafone Group Plc
Annual Report 2014
Vodafone Group Plc
Annual Report 20141616