Vodafone 2014 Annual Report Download - page 145
Download and view the complete annual report
Please find page 145 of the 2014 Vodafone annual report below. You can navigate through the pages in the report by either clicking on the pages listed below, or by using the keyword search tool below to find specific information within the annual report.-
 1
1 -
2
-
3
-
4
-
5
-
6
-
7
-
8
-
9
-
10
-
11
-
12
-
13
-
14
-
15
-
16
-
17
-
18
-
19
-
20
-
21
-
22
-
23
-
24
-
25
-
26
-
27
-
28
-
29
-
30
-
31
-
32
-
33
-
34
-
35
-
36
-
37
-
38
-
39
-
40
-
41
-
42
-
43
-
44
-
45
-
46
-
47
-
48
-
49
-
50
-
51
-
52
-
53
-
54
-
55
-
56
-
57
-
58
-
59
-
60
-
61
-
62
-
63
-
64
-
65
-
66
-
67
-
68
-
69
-
70
-
71
-
72
-
73
-
74
-
75
-
76
-
77
-
78
-
79
-
80
-
81
-
82
-
83
-
84
-
85
-
86
-
87
-
88
-
89
-
90
-
91
-
92
-
93
-
94
-
95
-
96
-
97
-
98
-
99
-
100
-
101
-
102
-
103
-
104
-
105
-
106
-
107
-
108
-
109
-
110
-
111
-
112
-
113
-
114
-
115
-
116
-
117
-
118
-
119
-
120
-
121
-
122
-
123
-
124
-
125
-
126
-
127
-
128
-
129
-
130
-
131
-
132
-
133
-
134
-
 135
135 -
 136
136 -
 137
137 -
 138
138 -
 139
139 -
 140
140 -
 141
141 -
 142
142 -
 143
143 -
 144
144 -
 145
145 -
 146
146 -
 147
147 -
 148
148 -
 149
149 -
 150
150 -
 151
151 -
 152
152 -
 153
153 -
 154
154 -
 155
155 -
156
-
157
-
158
-
159
-
160
-
161
-
162
-
163
-
164
-
165
-
166
-
167
-
168
-
169
-
170
-
171
-
172
-
173
-
174
-
175
-
176
-
177
-
178
-
179
-
180
-
181
-
182
-
183
-
184
-
185
-
186
-
187
-
188
-
189
-
190
-
191
-
192
-
193
-
194
-
195
-
196
-
197
-
198
-
199
-
200
-
201
-
202
-
203
-
204
-
205
-
206
-
207
-
208
-
209
-
210
-
211
-
212
-
213
-
214
-
215
-
216
 |
 |

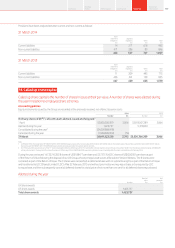
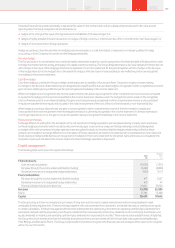
Borrowing facilities
Committed facilities expiry
2014
Restated
2013
Drawn Undrawn Drawn Undrawn
£m £m £m £m
Within one year 590 70 1,994 298
In one to two years 451 13 1,306 50
In two to three years 171 2,643 1,288 3,569
In three to four years 565 35 559 2,794
In four to ve years –3,188 – –
In more than ve years 1,728 582 1,037 422
31 March 3,505 6,531 6,184 7,133
At 31 March the Group’s most signicant committed facilities comprised two revolving credit facilities which remain undrawn throughout the period
of US$4,245 million (£2,545 million) and €3,860 million (£3,188 million) maturing in three and ve years respectively. Under the terms of these bank
facilities, lenders have the right, but not the obligation, to cancel their commitment 30 days from the date of notication of a change of control of the
Company and have outstanding advances repaid on the last day of the current interest period. The facility agreements provide for certain structural
changes that do not affect the obligations of the Company to be specically excluded from the denition of a change of control. This is in addition
to the rights of lenders to cancel their commitment if the Company has committed an event of default.
The terms and conditions of the drawn facilities in the Group’s Italian, German, Turkish and Romanian operations (€1,560 million in aggregate)
and the undrawn facilities in the Group’s UK and Irish operations (totalling £450 million) are similar to those of the US dollar and euro revolving credit
facilities. Further information on these facilities can be found in note 22 “Liquidity and capital resources”.
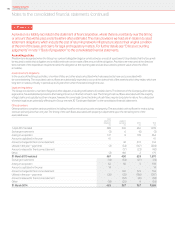
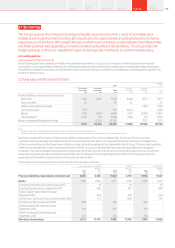
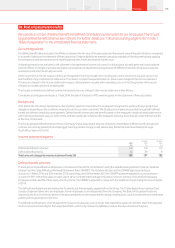
22. Liquidity and capital resources
This section includes an analysis of net debt, which we use to manage capital, and committed borrowing facilities.
Net debt
Net debt was £13.7 billion at 31 March 2014 and includes liabilities for amounts payable under the domination agreement in relation to Kabel
Deutschland (£1.4 billion) and deferred spectrum licence costs in India (£1.5 billion). This decreased by £11.7 billion in the year as the proceeds from
the disposal of the US sub-group including our interest in Verizon Wireless, positive free cash ow and favourable foreign exchange movements
more than offset the impact of the acquisition of Kabel Deutschland, payments for licences and spectrum, equity shareholder dividends, the return
of value and share buybacks.
Net debt represented 23.5% of our market capitalisation at 31 March 2014 compared to 27.8% at 31 March 2013. Average net debt at month end
accounting dates over the 12 month period ended 31 March 2014 was £22.9 billion and ranged between net debt of £30.4 billion and a net surplus
of funds of £2.7 billion.
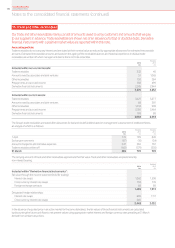
Our consolidated net debt position at 31 March was as follows:
2014
Restated
2013
£m £m
Cash and cash equivalents 10,134 7,531
Short-term borrowings
Bonds (1,783) (2,133)
Commercial paper1(950) (4,054)
Put options over non-controlling interests (2,330) (938)
Bank loans (1,263) (2,438)
Other short-term borrowings2(1,421) (2,237)
(7,747) (11,800)
Long-term borrowings
Put options over non-controlling interests (6) (77)
Bonds, loans and other long-term borrowings (21,448) (27,827)
(21,454) (27,904)
Other nancial instruments35,367 6,819
Net debt (13,700) (25,354)
Notes:
1 At 31 March 2014 US$578 million was drawn under the US commercial paper programme and €731 million was drawn under the euro commercial paper programme.
2 At 31 March 2014 the amount includes £1,185 million (2013: £1,151 million) in relation to cash received under collateral support agreements.
3 Comprises mark-to-market adjustments on derivative nancial instruments which are included as a component of trade and other receivables (2014: £2,443 million; 2013: £3,032 million) and trade and other payables
(2014: £881 million; 2013: £1,101 million) and short-term investments primarily in index linked government bonds and managed investment funds included as a component of other investments (2014: £3,805 million;
2013: £4,888 million).
Vodafone Group Plc
Annual Report 2014 143Overview
Strategy
review Performance Governance Financials Additional
information