Vodafone 2014 Annual Report Download - page 101
Download and view the complete annual report
Please find page 101 of the 2014 Vodafone annual report below. You can navigate through the pages in the report by either clicking on the pages listed below, or by using the keyword search tool below to find specific information within the annual report.-
 1
1 -
2
-
3
-
4
-
5
-
6
-
7
-
8
-
9
-
10
-
11
-
12
-
13
-
14
-
15
-
16
-
17
-
18
-
19
-
20
-
21
-
22
-
23
-
24
-
25
-
26
-
27
-
28
-
29
-
30
-
31
-
32
-
33
-
34
-
35
-
36
-
37
-
38
-
39
-
40
-
41
-
42
-
43
-
44
-
45
-
46
-
47
-
48
-
49
-
50
-
51
-
52
-
53
-
54
-
55
-
56
-
57
-
58
-
59
-
60
-
61
-
62
-
63
-
64
-
65
-
66
-
67
-
68
-
69
-
70
-
71
-
72
-
73
-
74
-
75
-
76
-
77
-
78
-
79
-
80
-
81
-
82
-
83
-
84
-
85
-
86
-
87
-
88
-
89
-
90
-
 91
91 -
 92
92 -
 93
93 -
 94
94 -
 95
95 -
 96
96 -
 97
97 -
 98
98 -
 99
99 -
 100
100 -
 101
101 -
 102
102 -
 103
103 -
 104
104 -
 105
105 -
 106
106 -
 107
107 -
 108
108 -
 109
109 -
 110
110 -
 111
111 -
112
-
113
-
114
-
115
-
116
-
117
-
118
-
119
-
120
-
121
-
122
-
123
-
124
-
125
-
126
-
127
-
128
-
129
-
130
-
131
-
132
-
133
-
134
-
135
-
136
-
137
-
138
-
139
-
140
-
141
-
142
-
143
-
144
-
145
-
146
-
147
-
148
-
149
-
150
-
151
-
152
-
153
-
154
-
155
-
156
-
157
-
158
-
159
-
160
-
161
-
162
-
163
-
164
-
165
-
166
-
167
-
168
-
169
-
170
-
171
-
172
-
173
-
174
-
175
-
176
-
177
-
178
-
179
-
180
-
181
-
182
-
183
-
184
-
185
-
186
-
187
-
188
-
189
-
190
-
191
-
192
-
193
-
194
-
195
-
196
-
197
-
198
-
199
-
200
-
201
-
202
-
203
-
204
-
205
-
206
-
207
-
208
-
209
-
210
-
211
-
212
-
213
-
214
-
215
-
216
 |
 |

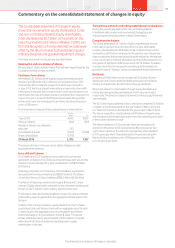
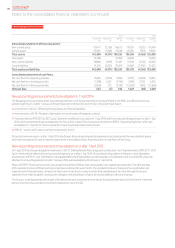
Commentary on the consolidated statement of nancial position
The consolidated statement of nancial position
shows all of our assets and liabilities at 31 March.
Further details on the major movements of both our assets and
liabilities in the year are set out below. Our statement of nancial
position has been materially impacted in the year by the sale of our
interest in Verizon Wireless, the acquisition of Kabel Deutschland
and the assumption of control over Vodafone Italy (jointly the
‘Group’s acquisitions’):
Assets
Goodwill and other intangible assets
Our total intangible assets increased to £46.7 billion from £44.1 billion.
The increase primarily arose as a result of £11.5 billion additions
as a result of the Group’s acquisitions and other additions of £3.7 billion,
including £1.9 billion of spectrum acquired in India, partially offset
by £6.6 billion of goodwill impairments, reductions of £2.6 billion
as a result of unfavourable movements in foreign exchange rates and
£3.5 billion of amortisation.
Property, plant and equipment
Property, plant and equipment increased to £22.9 billion from
£17.6 billion, principally as a result of £6.4 billion additions in the year
arising from Group acquisitions and a further £4.9 billion of purchases,
partially offset by £4.0 billion of depreciation charges and £1.5 billion
of adverse foreign exchange movements.
Investments in associates and joint ventures
Investments in associates and joint ventures decreased to £0.1 billion
(2013: £46.4 billion), primarily reecting a reduction of £43.2 billion
on the disposal of the Group’s investment in Verizon Wireless and the
transition of Vodafone Italy from a joint venture to a fully consolidated
subsidiary. Our share of the trading results of associates and joint
ventures was £3.5 billion, including £3.2 billion from Verizon Wireless
classied within discontinued operations.
Other non-current assets
Other non-current assets increased by £19.0 billion to £27.5 billion,
mainly due to a £17.8 billion increase in recognised deferred tax assets,
primarily in respect of additional tax losses in Germany and Luxembourg
(see note 6 “Taxation” for further details), and an increase of £2.8 billion
in other investments as a result of loan notes received in respect of the
disposal of the Group’s investment in Verizon Wireless, partly offset
by a £1.6 billion reduction in receivables, which was primarily due
to a reduction in amounts due from associates.
Total equity and liabilities
Total equity
Total equity decreased by £0.7 billion to £71.8 billion. Total
comprehensive income for the year of £56.7 billion was offset by the
return of value to shareholders of £51.0 billion and other dividends paid
to equity shareholders and non-controlling interests of £5.1 billion.
Borrowings
Total borrowings decreased to £29.2 billion from £39.7 billion, primarily
as the result of the redemption of US$5.65 billion of bonds following
the sale of our interest in Verizon Wireless and also due to £2.7 billion
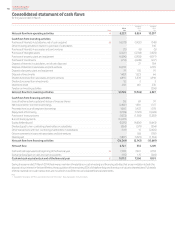
favourable foreign exchange movements. A net debt reconciliation
is provided on page 103.
Deferred taxation liabilities
Deferred tax liabilities reduced to £0.7 billion from £6.7 billion mainly
due to the disposal of the US Group that held substantial deferred tax
liabilities to Verizon Communications.
Other current liabilities
Other current liabilities increased to £16.4 billion (2013: £14.6 billion).
Trade payables at 31 March 2014 were equivalent to 40 days
(2013: 37days) outstanding, calculated by reference to the amount
owed to suppliers as a proportion of the amounts invoiced by suppliers
during the year. It is our policy to agree terms of transactions, including
payment terms, with suppliers and it is our normal practice that
payment is made accordingly.
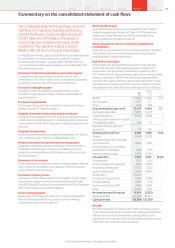
Contractual obligations and contingencies
A summary of our principal contractual nancial obligations is shown
below and details of the Group’s contingent liabilities are included
in note 30 “Contingent liabilities”.
Payments due by period
£m
Contractual obligations1Total < 1 year 1–3 years 3–5 years >5 years
Borrowings235,721 8,642 5,506 9,825 11,748
Operating lease
commitments35,732 1,128 1,519 1,034 2,051
Capital
commitments3,4 2,335 2,093 215 20 7
Purchase
commitments 4,420 3,426 578 191 225
Total 48,208 15,289 7,818 11,070 14,031
Notes:
1 This table includes commitments in respect of options over interests in Group businesses held by non-
controlling shareholders (see “Potential cash outows from option agreements and similar arrangements”
on page 146) and obligations to pay dividends to non-controlling shareholders (see “Dividends from
associates and to non-controlling shareholders” on page 146). The table excludes current and deferred tax
liabilities and obligations under post employment benet schemes, details of which are provided in notes
6 “Taxation” and 26 “Post employment benets” respectively. The table also excludes the contractual
obligations of associates and joint ventures.
2 See note 21 “Borrowings”.
3 See note 29 “Commitments”.
4 Primarily related to network infrastructure.
The nancial commentary on this page is unaudited.
Vodafone Group Plc
98 99Overview Strategy
review Performance Governance Financials
Additional
information