Vodafone 2014 Annual Report Download - page 83
Download and view the complete annual report
Please find page 83 of the 2014 Vodafone annual report below. You can navigate through the pages in the report by either clicking on the pages listed below, or by using the keyword search tool below to find specific information within the annual report.-
 1
1 -
2
-
3
-
4
-
5
-
6
-
7
-
8
-
9
-
10
-
11
-
12
-
13
-
14
-
15
-
16
-
17
-
18
-
19
-
20
-
21
-
22
-
23
-
24
-
25
-
26
-
27
-
28
-
29
-
30
-
31
-
32
-
33
-
34
-
35
-
36
-
37
-
38
-
39
-
40
-
41
-
42
-
43
-
44
-
45
-
46
-
47
-
48
-
49
-
50
-
51
-
52
-
53
-
54
-
55
-
56
-
57
-
58
-
59
-
60
-
61
-
62
-
63
-
64
-
65
-
66
-
67
-
68
-
69
-
70
-
71
-
72
-
 73
73 -
 74
74 -
 75
75 -
 76
76 -
 77
77 -
 78
78 -
 79
79 -
 80
80 -
 81
81 -
 82
82 -
 83
83 -
 84
84 -
 85
85 -
 86
86 -
 87
87 -
 88
88 -
 89
89 -
 90
90 -
 91
91 -
 92
92 -
 93
93 -
94
-
95
-
96
-
97
-
98
-
99
-
100
-
101
-
102
-
103
-
104
-
105
-
106
-
107
-
108
-
109
-
110
-
111
-
112
-
113
-
114
-
115
-
116
-
117
-
118
-
119
-
120
-
121
-
122
-
123
-
124
-
125
-
126
-
127
-
128
-
129
-
130
-
131
-
132
-
133
-
134
-
135
-
136
-
137
-
138
-
139
-
140
-
141
-
142
-
143
-
144
-
145
-
146
-
147
-
148
-
149
-
150
-
151
-
152
-
153
-
154
-
155
-
156
-
157
-
158
-
159
-
160
-
161
-
162
-
163
-
164
-
165
-
166
-
167
-
168
-
169
-
170
-
171
-
172
-
173
-
174
-
175
-
176
-
177
-
178
-
179
-
180
-
181
-
182
-
183
-
184
-
185
-
186
-
187
-
188
-
189
-
190
-
191
-
192
-
193
-
194
-
195
-
196
-
197
-
198
-
199
-
200
-
201
-
202
-
203
-
204
-
205
-
206
-
207
-
208
-
209
-
210
-
211
-
212
-
213
-
214
-
215
-
216
 |
 |

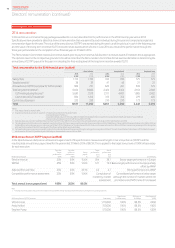
At 31 March 2014
Total number
of interests
in shares1
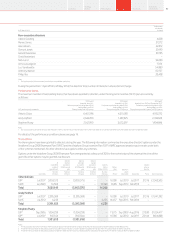
Non-executive directors
Valerie Gooding 4,038
Renee James 27,272
Alan Jebson 44,912
Samuel Jonah 3 0,19 0
Gerard Kleisterlee 59,755
Omid Kordestani –
Nick Land 32,090
Anne Lauvergeon 17,151
Luc Vandevelde 54,880
Anthony Watson 62,727
Philip Yea 33,408
Note:
1 During the year the Verizon transaction and a share consolidation took place.
During the period from 1 April 2014 to 20 May 2014, the directors’ total number of interests in shares did not change.
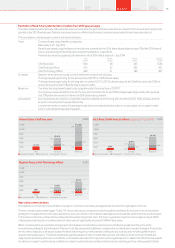
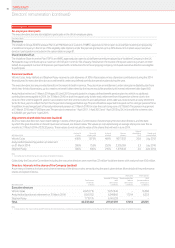
Performance shares
The maximum number of outstanding shares that have been awarded to directors under the long-term incentive (‘GLTI’) plan are currently
as follows:
GLTI performance share awards
2012 award
Awarded: June 2011
Performance period ending: March 2014
Vesting date: June 2014
Share price at grant: 163.2 pence
2013 award
Awarded: July 2012
Performance period ending: March 2015
Vesting date: July 2015
Share price at grant: 179.4 pence
2014 award
Awarded: June 2013 and September 20131
Performance period ending: March 2016
Vesting date: June 2016
Share price at grant: 180.2 pence and 202.5 pence
Vittorio Colao 6,461,396 4,511,080 4,185,370
Andy Halford 2,643,290 1,287,625 2,318,945
Stephen Pusey 2,162,990 2,072,397 1,904,846
Note:
1 Due to a close period, executive directors were not able to make co-investment commitments at the time of the main award in June 2013 and therefore part of the award was made in September 2013.
For details of the performance conditions please see page 74.
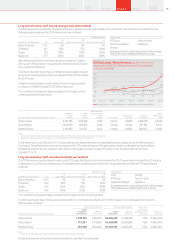
Share options
No share options have been granted to directors during the year. The following information summarises the executive directors’ options under the
Vodafone Group 2008 Sharesave Plan (‘SAYE’) and the Vodafone Group Incentive Plan (‘GIP’). HMRC approved awards may be made under both
of the schemes mentioned. No other directors have options under any schemes.
Options under the Vodafone Group 2008 Sharesave Plan were granted at a discount of 20% to the market value of the shares at the time of the
grant. No other options may be granted at a discount.
Grant date
At
1 April 2013
or date of
appointment
Options
granted
during the
2014 nancial
year
Options
exercised
during the
2014 nancial
year
Options
lapsed
during the
2014 nancial
year
Options
held at
31 March 2014
Option
price Date from
which
exercisable Expiry date
Market
price on
exercise
Gain on exercise
Number
of shares
Number
of shares
Number
of shares
Number
of shares
Number
of shares Pence1Pence
Vittorio Colao
GIP2Jul 2007 3,003,575 –(3,003,575) – – 167.80 Jul 2010 Jul 2017 213.16 £1,362,503
SAYE Jul 2009 16,568 – – – 16,568 93.85 Sep 2014 Feb 2015 –
Total 3,020,143 –(3,003,575) –16,568
Andy Halford
GIP2Jul 2007 2,295,589 –(2,295,589) – – 167.80 Jul 2010 Jul 2017 213.16 £1,041,392
SAYE Jul 2012 6,233 – – 6,233 144.37 Sep 2015 Feb 2016 –
Total 2,301,822 – (2,295,589) –6,233
Stephen Pusey
GIP3Sep 2006 1,034,259 –(1,034,259) – – 113.75 Sep 2009 Aug 2016 212.80 £1,024,417
GIP2Jul 2007 947, 556 –(947,556) – – 167.80 Jul 2010 Jul 2017 231.64 £604,888
Total 1,981,815 –(1,981,815) – –
Notes:
1 The closing trade share price on 31 March 2014 was 220.25 pence. The highest trade share price during the year was 252.3 pence and the lowest price was 180.23 pence.
2 The performance condition on the options granted in July 2007 was a three year cumulative growth in adjusted earnings per share. The options vested at 100% in July 2010.
3 The performance condition on the options granted in September 2006 was a three year cumulative growth in adjusted earnings per share. The options vested at 100% in September 2009.
81Overview
Strategy
review Performance Governance Financials Additional
information