Vodafone 2014 Annual Report Download - page 174
Download and view the complete annual report
Please find page 174 of the 2014 Vodafone annual report below. You can navigate through the pages in the report by either clicking on the pages listed below, or by using the keyword search tool below to find specific information within the annual report.-
 1
1 -
2
-
3
-
4
-
5
-
6
-
7
-
8
-
9
-
10
-
11
-
12
-
13
-
14
-
15
-
16
-
17
-
18
-
19
-
20
-
21
-
22
-
23
-
24
-
25
-
26
-
27
-
28
-
29
-
30
-
31
-
32
-
33
-
34
-
35
-
36
-
37
-
38
-
39
-
40
-
41
-
42
-
43
-
44
-
45
-
46
-
47
-
48
-
49
-
50
-
51
-
52
-
53
-
54
-
55
-
56
-
57
-
58
-
59
-
60
-
61
-
62
-
63
-
64
-
65
-
66
-
67
-
68
-
69
-
70
-
71
-
72
-
73
-
74
-
75
-
76
-
77
-
78
-
79
-
80
-
81
-
82
-
83
-
84
-
85
-
86
-
87
-
88
-
89
-
90
-
91
-
92
-
93
-
94
-
95
-
96
-
97
-
98
-
99
-
100
-
101
-
102
-
103
-
104
-
105
-
106
-
107
-
108
-
109
-
110
-
111
-
112
-
113
-
114
-
115
-
116
-
117
-
118
-
119
-
120
-
121
-
122
-
123
-
124
-
125
-
126
-
127
-
128
-
129
-
130
-
131
-
132
-
133
-
134
-
135
-
136
-
137
-
138
-
139
-
140
-
141
-
142
-
143
-
144
-
145
-
146
-
147
-
148
-
149
-
150
-
151
-
152
-
153
-
154
-
155
-
156
-
157
-
158
-
159
-
160
-
161
-
162
-
163
-
 164
164 -
 165
165 -
 166
166 -
 167
167 -
 168
168 -
 169
169 -
 170
170 -
 171
171 -
 172
172 -
 173
173 -
 174
174 -
 175
175 -
 176
176 -
 177
177 -
 178
178 -
 179
179 -
 180
180 -
 181
181 -
 182
182 -
 183
183 -
 184
184 -
185
-
186
-
187
-
188
-
189
-
190
-
191
-
192
-
193
-
194
-
195
-
196
-
197
-
198
-
199
-
200
-
201
-
202
-
203
-
204
-
205
-
206
-
207
-
208
-
209
-
210
-
211
-
212
-
213
-
214
-
215
-
216
 |
 |

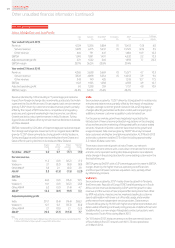
Prior year operating results (continued)
Europe
% change
Germany
£m
Italy
£m
UK
£m
Spain
£m
Other Europe
£m
Eliminations
£m
Europe
£m £Organic
Year ended 31 March 2013
Revenue 7, 8 57 4,755 5,150 3,904 7,115 (179) 28,602 (5.7) (5.5)
Service revenue 7, 2 75 4,380 4,782 3,629 6, 610 (175) 26,501 (5.9) (5.8)
Other revenue 582 375 368 275 505 (4) 2,101 (3.2) (1.3)
EBITDA 2,831 1,917 1,210 1,021 2,120 –9,099 (11.0) (8.1)
Adjusted operating prot 1,401 1,172 303 421 878 –4,175 (21.4) (15.8)
EBITDA margin 36.0% 40.3% 23.5% 26.2% 29.8% 31.8%
Year ended 31 March 2012
Revenue 8,233 5,658 5,397 4,763 6,469 (198) 30,322 0.2 (1.2)
Service revenue 7, 6 69 5,329 4,996 4,357 5,994 (193) 28 ,152 (0.9) (2.1)
Other revenue 564 329 401 406 475 (5) 2 ,170 16.4 13.6
EBITDA 3,034 2,521 1,294 1,210 2 ,16 0 –10,219 (3.4) (4.8)
Adjusted operating prot 1, 561 1, 742 406 583 1,018 –5,310 (8.0) (9.4)
EBITDA margin 36.9% 44.6% 24.0% 25.4% 33.4% 33.7%
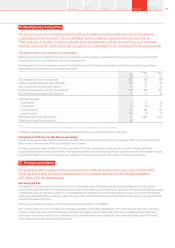
Revenue decreased by 5.7% including a 4.6 percentage point adverse
impact from unfavourable foreign exchange rate movements.
On an organic basis service revenue decreased by 5.8%* as data
revenue was offset by the impact of MTR cuts and competitive pricing
pressures. Organic growth in Germany was more than offset by declines
in all of the major markets.
EBITDA decreased by 11.0% including a 4.7 percentage point adverse
impact from foreign exchange rate movements. On an organic basis,
EBITDA decreased by 8.1%*, driven by lower service revenue and higher
customer investment due to the increased penetration of smartphones.
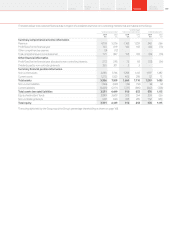
Organic
change
%
Other
activity1
pps
Foreign
exchange
pps
Reported
change
%
Revenue – Europe (5.5) 4.4 (4.6) (5.7)
Service revenue
Germany 0.5 (0.1) (5.5) (5.1)
Italy (12.8) (0.1) (4.9) (17.8)
UK (4.0) (0.3) –(4.3)
Spain (11.5) (0.2) (5.0) (16.7)
Other Europe (5.2) 22.4 (6.9) 10.3
Europe (5.8) 4.5 (4.6) (5.9)
EBITDA
Germany (1.7) 0.2 (5.2) (6.7)
Italy (19.3) –(4.7) (24.0)
UK (6.8) 0.4 (0.1) (6.5)
Spain (9.8) (0.5) (5.3) (15.6)
Other Europe (3.7) 8 .1 (6.3) (1.9)
Europe (8.1) 1.8 (4.7) (11.0)
Adjusted operating prot
Germany (5.5) 0.3 (5.0) (10.2)
Italy (28.5) –(4.2) (32.7)
UK (26.3) 0.9 –(25.4)
Spain (21.8) (1.0) (5.0) (27.8)
Other Europe (2.0) (6.1) (5.7) (13.8)
Europe (15.8) (1.1) (4.5) (21.4)
Note:
1 “Other activity” includes the impact of M&A activity and the revision to intra-group roaming charges from
1October 2011. Refer to “Organic growth” on page 202 for further detail.
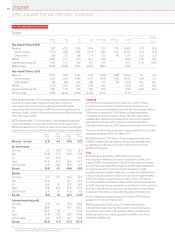
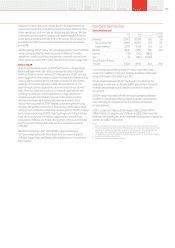
Germany
Service revenue increased by 0.5%*, driven by a 1.3%* increase
in mobile revenue. Growth in enterprise and wholesale revenue,
despite intense price competition, was offset by lower prepaid revenue.
Data revenue increased by 13.6%* driven by higher penetration
of smartphones and an increase in those sold with a data bundle.
Vodafone Red, introduced in October 2012, performed in line with
expectations and had a positive impact on customer perception.
Enterprise revenue grew by 3.0%*, despite the competitive environment.
The roll-out of 4G services continued and was available in 81 cities, with
population coverage of 61% at 31 March 2013.
EBITDA declined by 1.7%*, with a 1.0* percentage point reduction
in EBITDA margin, driven by higher customer costs, partially offset
by operating cost efciencies and a one-off benet from a legal
settlement during Q2.
Italy
Service revenue declined by 12.8%* driven by the severe
macroeconomic weakness and intense competition, as well as the
impact of MTR cuts starting from 1 July 2012. Data revenue increased
by 4.4%* driven by mobile internet growth and the higher penetration
of smartphones, which more than offset the decline in mobile
broadband revenue. Vodafone Red plans, branded as “Vodafone Relax”
in Italy, continued to perform well and now account for approximately
30% of the contract customer base at 31 March 2013. The majority
of contract additions are Vodafone Relax tariffs. Fixed revenue declined
by 6.8%* driven by intense competition and a reduction in the customer
base due to the decision to stop consumer acquisitions in areas where
margins are impacted by unfavourable regulated wholesale prices.
4G commercial services were launched in October 2012 and were
available in 21 cities at 31 March 2013.
EBITDA declined by 19.3%*, with a 4.3* percentage point fall
in the EBITDA margin, driven by the decline in service revenue and
an increase in commercial costs, partially offset by operating cost
efciencies such as site sharing agreements and the outsourcing
of network maintenance.
Vodafone Group Plc
Annual Report 2014172
Other unaudited nancial information (continued)