Vodafone 2014 Annual Report Download - page 146
Download and view the complete annual report
Please find page 146 of the 2014 Vodafone annual report below. You can navigate through the pages in the report by either clicking on the pages listed below, or by using the keyword search tool below to find specific information within the annual report.-
 1
1 -
2
-
3
-
4
-
5
-
6
-
7
-
8
-
9
-
10
-
11
-
12
-
13
-
14
-
15
-
16
-
17
-
18
-
19
-
20
-
21
-
22
-
23
-
24
-
25
-
26
-
27
-
28
-
29
-
30
-
31
-
32
-
33
-
34
-
35
-
36
-
37
-
38
-
39
-
40
-
41
-
42
-
43
-
44
-
45
-
46
-
47
-
48
-
49
-
50
-
51
-
52
-
53
-
54
-
55
-
56
-
57
-
58
-
59
-
60
-
61
-
62
-
63
-
64
-
65
-
66
-
67
-
68
-
69
-
70
-
71
-
72
-
73
-
74
-
75
-
76
-
77
-
78
-
79
-
80
-
81
-
82
-
83
-
84
-
85
-
86
-
87
-
88
-
89
-
90
-
91
-
92
-
93
-
94
-
95
-
96
-
97
-
98
-
99
-
100
-
101
-
102
-
103
-
104
-
105
-
106
-
107
-
108
-
109
-
110
-
111
-
112
-
113
-
114
-
115
-
116
-
117
-
118
-
119
-
120
-
121
-
122
-
123
-
124
-
125
-
126
-
127
-
128
-
129
-
130
-
131
-
132
-
133
-
134
-
135
-
 136
136 -
 137
137 -
 138
138 -
 139
139 -
 140
140 -
 141
141 -
 142
142 -
 143
143 -
 144
144 -
 145
145 -
 146
146 -
 147
147 -
 148
148 -
 149
149 -
 150
150 -
 151
151 -
 152
152 -
 153
153 -
 154
154 -
 155
155 -
 156
156 -
157
-
158
-
159
-
160
-
161
-
162
-
163
-
164
-
165
-
166
-
167
-
168
-
169
-
170
-
171
-
172
-
173
-
174
-
175
-
176
-
177
-
178
-
179
-
180
-
181
-
182
-
183
-
184
-
185
-
186
-
187
-
188
-
189
-
190
-
191
-
192
-
193
-
194
-
195
-
196
-
197
-
198
-
199
-
200
-
201
-
202
-
203
-
204
-
205
-
206
-
207
-
208
-
209
-
210
-
211
-
212
-
213
-
214
-
215
-
216
 |
 |
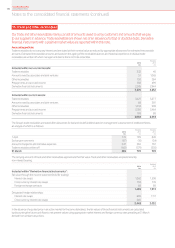
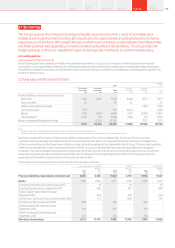
22. Liquidity and capital resources (continued)
At 31 March 2014 we had £10,134 million of cash and cash equivalents which are held in accordance with the counterparty and settlement risk
limits of the Board approved treasurypolicy. The main forms of liquid investment at 31 March 2014 were managed investment funds, money market
funds, UK index linked government bonds, tri-party repurchase agreements and bankdeposits.
The cash received from collateral support agreements mainly reects the value of our interest rate swap portfolio which is substantially netpresent
value positive. See note 23 for further details on these agreements.
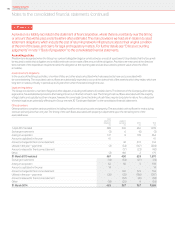
Commercial paper programmes
We currently have US and euro commercial paper programmes of US$15 billion and £5 billion respectively which are available to be used
to meet short-term liquidity requirements. At 31 March 2014 amounts external to the Group of €731 million (£604 million) were drawn under
the euro commercial paper programme and US$578 million (£346 million) were drawn down under the US commercial paper programme,
with such funds being provided by counterparties external to the Group. At 31 March 2013 amounts external to the Group of €2,006 million
(£1,693 million), US$35 million (£23 million), £10 million and JPY 5 billion (£35 million) were drawn under the euro commercial paper programme
and US$3,484 million (£2,293 million) was drawn down under the US commercial paper programme. The commercial paper facilities were
supported by US$4.2 billion (£2.5 billion) and €3.9 billion (£3.2 billion) of syndicated committed bank facilities (see “Committed facilities” opposite).
No amounts had been drawn under either bank facility.
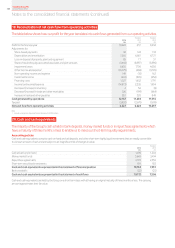
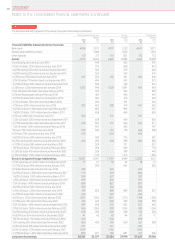
Bonds
We have a €30 billion euro medium-term note programme and a US shelf programme which are used to meet medium to long-term funding
requirements. At 31 March 2014 the total amounts in issue under these programmes split by currency were US$14.6 billion, £2.6 billion and
€6.2 billion.
At 31 March 2014 we had bonds outstanding with a nominal value of £16,979 million (2013: £22,837 million). No bonds were issued in the year
ended 31 March 2014.
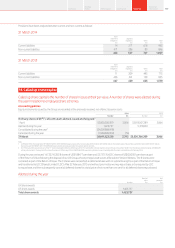
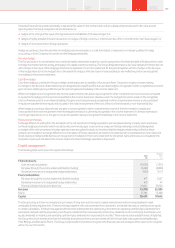
Share buyback programmes
Following the receipt of a US$3.8 billion (£2.4 billion) dividend from Verizon Wireless in December 2012, we initiated a £1.5 billion share buyback
programme under the authority granted by our shareholders at the 2012 annual general meeting. The Group placed irrevocable purchase
instructions to enable shares to be repurchased on our behalf when we may otherwise have been prohibited from buying in the market. The share
buyback programme concluded at the end of June 2013.
Details of the shares purchased under the programme, including those purchased under irrevocable instructions, are shown below:
Number
of shares
purchased1, 4
Average price paid
per share inclusive of
transaction costs
Total number of
shares purchased under
publicly announced share
buyback programme2
Maximum value
of shares that may
yet be purchased
under the programme3
Date of share purchase ’000 Pence ’000 £m
April 2013 43,000 192.54 314,651 968
May 2013 204,750 196.09 519,401 567
June 2013 304,300 180.52 823,701 –
Total 552,050 187.23 823,701 –
Notes:
1 The nominal value of shares purchased is 113
/7 US cents each.
2 No shares were purchased outside the publicly announced share buyback programme.
3 In accordance with authorities granted by shareholders in general meeting.
4 The total number of shares purchased represents 1.1% of our issued share capital, excluding treasury shares, at the end of June 2013.
The Group held a maximum of 5,099 million shares during the year which represents 9.5% of issued share capital at that time.
Notes to the consolidated nancial statements (continued)
Vodafone Group Plc
Annual Report 2014144