Vodafone 2014 Annual Report Download - page 173
Download and view the complete annual report
Please find page 173 of the 2014 Vodafone annual report below. You can navigate through the pages in the report by either clicking on the pages listed below, or by using the keyword search tool below to find specific information within the annual report.-
 1
1 -
2
-
3
-
4
-
5
-
6
-
7
-
8
-
9
-
10
-
11
-
12
-
13
-
14
-
15
-
16
-
17
-
18
-
19
-
20
-
21
-
22
-
23
-
24
-
25
-
26
-
27
-
28
-
29
-
30
-
31
-
32
-
33
-
34
-
35
-
36
-
37
-
38
-
39
-
40
-
41
-
42
-
43
-
44
-
45
-
46
-
47
-
48
-
49
-
50
-
51
-
52
-
53
-
54
-
55
-
56
-
57
-
58
-
59
-
60
-
61
-
62
-
63
-
64
-
65
-
66
-
67
-
68
-
69
-
70
-
71
-
72
-
73
-
74
-
75
-
76
-
77
-
78
-
79
-
80
-
81
-
82
-
83
-
84
-
85
-
86
-
87
-
88
-
89
-
90
-
91
-
92
-
93
-
94
-
95
-
96
-
97
-
98
-
99
-
100
-
101
-
102
-
103
-
104
-
105
-
106
-
107
-
108
-
109
-
110
-
111
-
112
-
113
-
114
-
115
-
116
-
117
-
118
-
119
-
120
-
121
-
122
-
123
-
124
-
125
-
126
-
127
-
128
-
129
-
130
-
131
-
132
-
133
-
134
-
135
-
136
-
137
-
138
-
139
-
140
-
141
-
142
-
143
-
144
-
145
-
146
-
147
-
148
-
149
-
150
-
151
-
152
-
153
-
154
-
155
-
156
-
157
-
158
-
159
-
160
-
161
-
162
-
 163
163 -
 164
164 -
 165
165 -
 166
166 -
 167
167 -
 168
168 -
 169
169 -
 170
170 -
 171
171 -
 172
172 -
 173
173 -
 174
174 -
 175
175 -
 176
176 -
 177
177 -
 178
178 -
 179
179 -
 180
180 -
 181
181 -
 182
182 -
 183
183 -
184
-
185
-
186
-
187
-
188
-
189
-
190
-
191
-
192
-
193
-
194
-
195
-
196
-
197
-
198
-
199
-
200
-
201
-
202
-
203
-
204
-
205
-
206
-
207
-
208
-
209
-
210
-
211
-
212
-
213
-
214
-
215
-
216
 |
 |

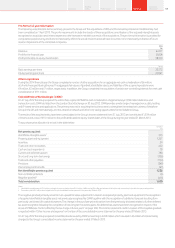
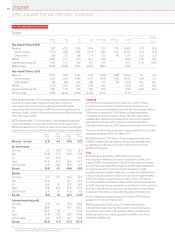
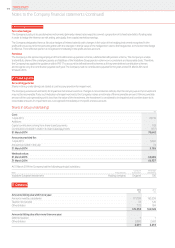
Prior year operating results
This section presents our operating performance for the 2013 nancial year compared to the 2012 nancial
year, providing commentary on the revenue and EBITDA performance of the Group and its regions. The results
in this section are presented on a management basis, which includes the results of the Group’s joint ventures
on a proportionate basis, consistent with how the business is managed, operated and reviewed by management.
See note 2 “Segmental analysis” to the consolidated nancial statements for further information and
reconciliations between the management and statutory basis.
Group1,2
Europe
£m
AMAP
£m
Non-Controlled
Interests and
Common
Functions3
£m
Eliminations
£m
Restated1
2013
£m
Restated1
2012
£m
% change
£Organic
Revenue 28,602 15,413 481 (51) 44,445 4 6,417 (4.2) (1.4)
Service revenue 26,501 13,729 315 (50) 40,495 42,581 (4.9) (1.9)
Other revenue 2,101 1,684 166 (1) 3,950 3,836 3.0 4.0
EBITDA 9,099 4,532 (65) –13,566 14,606 (7.1) (1.9)
Adjusted operating prot 4,175 1,893 6,509 –12,577 12,030 4.5 9.5
Adjustments for:
Presentation adjustments4 (487) (690)
Discontinued operations5(6,500) (4,953)
Impairment loss (7,700) (4,050)
Restructuring costs and other one-off items (311) (144)
Amortisation of acquired customer base and brand intangible assets (249) (280)
Other income and expense 468 3,705
Operating (loss)/prot – statutory basis (2,202) 5,618
Notes:
1 All amounts are presented on the Group’s revised segment basis. EBITDA and adjusted operating prot have been restated to exclude restructuring costs and amortisation of customer base and brand intangible assets.
2 2013 results reect average foreign exchange rates of £1:€1.23 and £1:US$1.58 (2012: £1:€1.16 and £1:US$1.60).
3 Common Functions primarily represent the results of the partner markets and the net result of unallocated central Group costs
4 Presentation adjustments relate to the restatement of the Group’s joint ventures from a proportionate consolidation basis to an equity accounting basis.
5 Discontinued operations relate to the results of Verizon Wireless.
Revenue
Group revenue fell by 4.2% to £44.4 billion, with service revenue
of £40.5 billion, a decline of 1.9%* on an organic basis. Our performance
reected continued strong demand for data services and good
growth in our major emerging markets, offset by regulatory changes,
challenging macroeconomic conditions, particularly in Europe,
and continued competitive pressures.
In Europe service revenue declined by 5.8%* as growth in Germany
was offset by increased competition, macroeconomic pressure and
MTR cuts.
In AMAP service revenue increased by 5.5%* with continued growth
in all of our markets apart from Australia and New Zealand.
EBITDA and prot
Group EBITDA decreased by 7.1% to £13.6 billion, primarily driven
by lower revenue, partially offset by operating cost efciencies.
Adjusted operating prot grew by 4.5%, driven by 31.2% growth in our
share of prots of Verizon Wireless (‘VZW’) to £6.5 billion, partially offset
by lower EBITDA.
The operating (loss)/prot decreased from a prot £5.6 billion in the
prior year to a loss of £2.2 billion primarily due to the gains on the
disposal of the Group’s interests in SFR and Polkomtel in the prior year
and the higher impairment charges in the current year, partially offset
by the gain on acquisition of CWW of £0.5 billion.
An impairment loss of £7.7 billion was recorded in relation to Italy and
Spain, primarily driven by adverse performance against previous plans
and adverse movements in discount rates.
171Overview
Strategy
review Performance Governance Financials Additional
information
Other unaudited nancial information