Vodafone 2014 Annual Report Download - page 13
Download and view the complete annual report
Please find page 13 of the 2014 Vodafone annual report below. You can navigate through the pages in the report by either clicking on the pages listed below, or by using the keyword search tool below to find specific information within the annual report.-
 1
1 -
2
-
 3
3 -
 4
4 -
 5
5 -
 6
6 -
 7
7 -
 8
8 -
 9
9 -
 10
10 -
 11
11 -
 12
12 -
 13
13 -
 14
14 -
 15
15 -
 16
16 -
 17
17 -
 18
18 -
 19
19 -
 20
20 -
 21
21 -
 22
22 -
 23
23 -
24
-
25
-
26
-
27
-
28
-
29
-
30
-
31
-
32
-
33
-
34
-
35
-
36
-
37
-
38
-
39
-
40
-
41
-
42
-
43
-
44
-
45
-
46
-
47
-
48
-
49
-
50
-
51
-
52
-
53
-
54
-
55
-
56
-
57
-
58
-
59
-
60
-
61
-
62
-
63
-
64
-
65
-
66
-
67
-
68
-
69
-
70
-
71
-
72
-
73
-
74
-
75
-
76
-
77
-
78
-
79
-
80
-
81
-
82
-
83
-
84
-
85
-
86
-
87
-
88
-
89
-
90
-
91
-
92
-
93
-
94
-
95
-
96
-
97
-
98
-
99
-
100
-
101
-
102
-
103
-
104
-
105
-
106
-
107
-
108
-
109
-
110
-
111
-
112
-
113
-
114
-
115
-
116
-
117
-
118
-
119
-
120
-
121
-
122
-
123
-
124
-
125
-
126
-
127
-
128
-
129
-
130
-
131
-
132
-
133
-
134
-
135
-
136
-
137
-
138
-
139
-
140
-
141
-
142
-
143
-
144
-
145
-
146
-
147
-
148
-
149
-
150
-
151
-
152
-
153
-
154
-
155
-
156
-
157
-
158
-
159
-
160
-
161
-
162
-
163
-
164
-
165
-
166
-
167
-
168
-
169
-
170
-
171
-
172
-
173
-
174
-
175
-
176
-
177
-
178
-
179
-
180
-
181
-
182
-
183
-
184
-
185
-
186
-
187
-
188
-
189
-
190
-
191
-
192
-
193
-
194
-
195
-
196
-
197
-
198
-
199
-
200
-
201
-
202
-
203
-
204
-
205
-
206
-
207
-
208
-
209
-
210
-
211
-
212
-
213
-
214
-
215
-
216
 |
 |

11
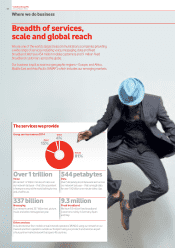
Assets
Networks
We aim to have the best mobile network in each of our markets,
combined with competitive xed networks in our main markets.
This means giving our customers far-reaching coverage, a very reliable
connection, and increasing speeds and data capacity. We believe
that over time, offering a superior network experience will enable
us to secure a premium positioning in most of our markets. We combine
our ongoing high level of network investment with a commitment
to securing the best possible portfolio of spectrum. For more
information on our network strategy see page 30.
Distribution and customer service
We reach our customers through around 14,500 exclusive branded
stores including franchises, a broad network of distribution partners and
third party retailers. The Internet, whether accessed through a mobile
device or PC, is becoming an increasingly important channel for both
sales and after sales service. Our call centres are available 24hours
a day, seven days a week in all our European markets.
Supplier relationships
In the last nancial year we spent around £16 billion buying equipment,
devices and services. Given our large scale and global reach, we tend
to be a key strategic partner for many of our suppliers. We work closely
with them to build robust networks, develop innovative services and
offer the widest range of the latest devices.
People
During the year we employed an average of nearly 93,000 people.
We support, train and encourage our employees, ensuring they have
the right capabilities, commitment and enthusiasm to achieve our
targets and build on our success in delivering an outstanding experience
to all our customers. We are working hard to build a more diverse
workforce that is more representative of our customer base. For more
information on our people see page 36.
Brand
Today, Vodafone is the UK’s most valuable brand with an attributed
worth of US$30 billion (Source: 2014 Brand Finance Global 500).
The strength of our brand raises the prole of our distribution channels
and is a major driver of purchasing decisions for consumers and
enterprise customers alike.
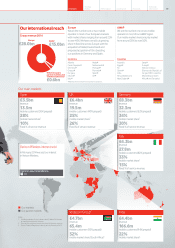
Customers
With 434 million customers globally, we are one of the biggest
mobile operators in the world. Over 90% of our mobile customers
are individuals and the rest are enterprise customers ranging from
large multinationals, to small and medium sized businesses, down
to the owner of the local corner shop. The majority and the growing
share of our mobile customers are in emerging markets. We also have
over nine million xed broadband customers, and most of these are
in Europe – in fact we are the fourth largest provider of xed broadband
services in Western Europe and will become the third following the
pending acquisition of Ono in Spain.
Revenue
Mobile consumers pay for our services either via contracts (typically
up to two years in length) or through buying their airtime in advance
(prepaid). Enterprise customers often have longer contracts.
Fixed customers typically pay via one to two year contracts.
We have a diverse service revenue stream with 51% from mobile
services in Europe, 30% from mobile operations in AMAP, 15% from
xed services and the remainder from other items such as MVNO
agreements. Within our mobile business, 51% of annual service revenue
arises from consumers’ monthly price plans, which we call in-bundled
revenue. In-bundled revenue is an increasing proportion of our business
and is relatively stable compared to out-of-bundle revenue, which
is much more vulnerable to competitive and economic pressure.
Cash ow
Our track record of converting revenue into cash ow is strong –
withsome £16 billion generated over the last three years. We achieve
this by operating efcient networks where we seek to minimise costs,
thus supporting our gross margin. We also have strong market share
positions – as we are typically the rst or second largest mobile operator
out of three or four in each market. This provides economies of scale
and is a key driver of cost efciencies and EBITDA margin, which in turn
provides healthy cash ow. See page 32 for more details of our plans
to improve our operating efciency.
Shareholder returns
The cash generated from operations allows us to sustain a generous
shareholder returns programme while also investing in the future
prosperity of the business – with almost £23 billion returned
to shareholders over the last three years, excluding the Verizon Wireless
return of value. With our strong nancial foundation, and as a sign of our
condence in our future performance, we intend to grow the annual
dividend per share each year going forward.
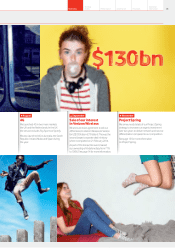
Reinvestment
We have maintained a high and consistent level of capex in recent years,
to support wider coverage, higher speeds and greater capacity in our
networks. Through our IT investment we are enhancing our customer
relationship capability and providing new customer billing services.
In addition, we have continued to invest in our stores, our internet and
social media presence and spectrum licences to support future services
and growth.
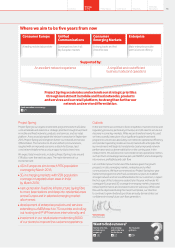
To boost our investment even more we started Project Spring,
our organic investment programme, which aims to accelerate and
extend our current strategy, and thereby strengthen further our
network and service differentiation. We expect total investments,
including Project Spring, to be around £19 billion over the next two
years. See page 13 for more details.
Want to nd out more?
Network
30
Operations
32
Our people
36
Financial review, including
revenue, cash ow and
shareholder returns
38
Risk management
and mitigation
46
11Overview Strategy
review Performance Governance Financials Additional
information