United Airlines 2009 Annual Report Download - page 82
Download and view the complete annual report
Please find page 82 of the 2009 United Airlines annual report below. You can navigate through the pages in the report by either clicking on the pages listed below, or by using the keyword search tool below to find specific information within the annual report.-
 1
1 -
2
-
3
-
4
-
5
-
6
-
7
-
8
-
9
-
10
-
11
-
12
-
13
-
14
-
15
-
16
-
17
-
18
-
19
-
20
-
21
-
22
-
23
-
24
-
25
-
26
-
27
-
28
-
29
-
30
-
31
-
32
-
33
-
34
-
35
-
36
-
37
-
38
-
39
-
40
-
41
-
42
-
43
-
44
-
45
-
46
-
47
-
48
-
49
-
50
-
51
-
52
-
53
-
54
-
55
-
56
-
57
-
58
-
59
-
60
-
61
-
62
-
63
-
64
-
65
-
66
-
67
-
68
-
69
-
70
-
71
-
 72
72 -
 73
73 -
 74
74 -
 75
75 -
 76
76 -
 77
77 -
 78
78 -
 79
79 -
 80
80 -
 81
81 -
 82
82 -
 83
83 -
 84
84 -
 85
85 -
 86
86 -
 87
87 -
 88
88 -
 89
89 -
 90
90 -
 91
91 -
 92
92 -
93
-
94
-
95
-
96
-
97
-
98
-
99
-
100
-
101
-
102
-
103
-
104
-
105
-
106
-
107
-
108
-
109
-
110
-
111
-
112
-
113
-
114
-
115
-
116
-
117
-
118
-
119
-
120
-
121
-
122
-
123
-
124
-
125
-
126
-
127
-
128
-
129
-
130
-
131
-
132
-
133
-
134
-
135
-
136
-
137
-
138
-
139
-
140
-
141
-
142
-
143
-
144
-
145
-
146
-
147
-
148
-
149
-
150
-
151
-
152
-
153
-
154
-
155
-
156
-
157
-
158
-
159
-
160
-
161
-
162
-
163
-
164
-
165
-
166
-
167
-
168
-
169
-
170
-
171
-
172
-
173
-
174
-
175
-
176
 |
 |

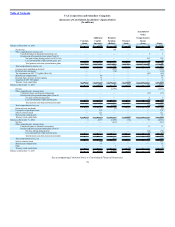
Table of Contents
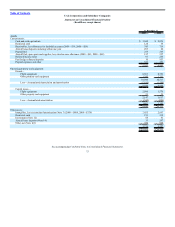
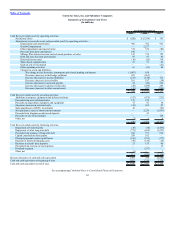
UAL Corporation and Subsidiary Companies
Statements of Consolidated Stockholders’ Equity (Deficit)
(In millions)
Common
Stock
Additional
Capital
Invested
Retained
Earnings
(Deficit)
Treasury
Stock
Accumulated
Other
Comprehensive
Income
(Loss) Total
Balance at December 31, 2006 $ 1 $ 2,306 $ (2) $ (4) $ 82 $ 2,383
Net income — — 360 — — 360
Other comprehensive income, net:
Unrealized gains on financial instruments, net — — — — 5 5
Pension and other postretirement plans (Note 8)
Net gain arising during period, net $63 of tax — — — — 102 102
Less: amortization of prior period gains, net — — — — (8) (8)
Total pension and other postretirement plans — — — — 94 94
Total comprehensive income, net — — 360 — 99 459
Common stock distribution declared — — (257) — — (257)
Preferred stock dividends — — (10) — — (10)
Tax adjustment on ASC 715 update (Note 10) — — — — (40) (40)
Share-based compensation — 49 — — — 49
Proceeds from exercise of stock options — 35 — — — 35
Adoption of ASC 740 update — 2 — — — 2
Treasury stock acquisitions — — — (11) — (11)
Balance at December 31, 2007 1 2,392 91 (15) 141 2,610
Net loss — — (5,396) — — (5,396)
Other comprehensive income (loss):
Unrealized losses on financial instruments — — — — (37) (37)
Pension and other postretirement plans (Note 8)
Net gain arising during period — — — — 8 8
Less: amortization of prior period gains — — — — (19) (19)
Total pension and other postretirement plans — — — — (11) (11)
Total comprehensive loss, net — — (5,396) — (48) (5,444)
Preferred stock dividends — — (3) — — (3)
Conversion of preferred stock — 374 — — — 374
Sale of common stock — 122 — — — 122
Share-based compensation — 31 — — — 31
Treasury stock acquisitions — — — (11) — (11)
Balance at December 31, 2008 1 2,919 (5,308) (26) 93 (2,321)
Net loss — — (651) — — (651)
Other comprehensive income (loss):
Unrealized gains on financial instruments — — — — 15 15
Pension and other postretirement plans (Note 8)
Net loss arising during period — — — — (64) (64)
Less: amortization of prior period gains — — — — (9) (9)
Total pension and other postretirement plans — — — — (73) (73)
Total comprehensive loss, net — — (651) — (58) (709)
Sale of common stock 1 206 — — — 207
Share-based compensation — 11 — — — 11
Other — — 3 — — 3
Treasury stock acquisitions — — — (2) — (2)
Balance at December 31, 2009 $ 2 $ 3,136 $ (5,956) $ (28) $ 35 $ (2,811)
See accompanying Combined Notes to Consolidated Financial Statements.
78