United Airlines 2009 Annual Report Download - page 37
Download and view the complete annual report
Please find page 37 of the 2009 United Airlines annual report below. You can navigate through the pages in the report by either clicking on the pages listed below, or by using the keyword search tool below to find specific information within the annual report.-
 1
1 -
2
-
3
-
4
-
5
-
6
-
7
-
8
-
9
-
10
-
11
-
12
-
13
-
14
-
15
-
16
-
17
-
18
-
19
-
20
-
21
-
22
-
23
-
24
-
25
-
26
-
 27
27 -
 28
28 -
 29
29 -
 30
30 -
 31
31 -
 32
32 -
 33
33 -
 34
34 -
 35
35 -
 36
36 -
 37
37 -
 38
38 -
 39
39 -
 40
40 -
 41
41 -
 42
42 -
 43
43 -
 44
44 -
 45
45 -
 46
46 -
 47
47 -
48
-
49
-
50
-
51
-
52
-
53
-
54
-
55
-
56
-
57
-
58
-
59
-
60
-
61
-
62
-
63
-
64
-
65
-
66
-
67
-
68
-
69
-
70
-
71
-
72
-
73
-
74
-
75
-
76
-
77
-
78
-
79
-
80
-
81
-
82
-
83
-
84
-
85
-
86
-
87
-
88
-
89
-
90
-
91
-
92
-
93
-
94
-
95
-
96
-
97
-
98
-
99
-
100
-
101
-
102
-
103
-
104
-
105
-
106
-
107
-
108
-
109
-
110
-
111
-
112
-
113
-
114
-
115
-
116
-
117
-
118
-
119
-
120
-
121
-
122
-
123
-
124
-
125
-
126
-
127
-
128
-
129
-
130
-
131
-
132
-
133
-
134
-
135
-
136
-
137
-
138
-
139
-
140
-
141
-
142
-
143
-
144
-
145
-
146
-
147
-
148
-
149
-
150
-
151
-
152
-
153
-
154
-
155
-
156
-
157
-
158
-
159
-
160
-
161
-
162
-
163
-
164
-
165
-
166
-
167
-
168
-
169
-
170
-
171
-
172
-
173
-
174
-
175
-
176
 |
 |

Table of Contents
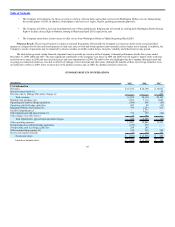
The following graph shows the cumulative total shareholder return for UAL common stock during the period from February 2, 2006 to December 31,
2009. Five year historical data is not presented since the financial results of the Successor UAL are not comparable with the results of the Predecessor UAL, as
discussed in Item 6, Selected Financial Data. The graph also shows the cumulative returns of the Standard and Poors (“S&P”) 500 Index and the AMEX Airline
Index (“AAI”) of 12 investor-owned airlines. The comparison assumes $100 was invested on February 2, 2006 (the date UAUA began trading on NASDAQ) in
UAL common stock and in each of the indices shown and assumes that all dividends paid, including UAL’s January 2008 $2.15 per share distribution, were
reinvested.
Note: The stock price performance shown in the graph above should not be considered indicative of potential future stock price performance.
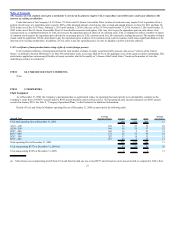
The following table presents repurchases of UAL common stock made in the fourth quarter of fiscal year 2009:
Period
Total number
of shares
purchased (a)
Average price
paid
per share
Total number of
shares purchased
as
part of publicly
announced
plans
or programs
Maximum number of
shares (or approximate
dollar value) of shares
that may yet be
purchased under the
plans or programs
10/01/09 – 10/31/09 2,354 $ 6.92 — (b)
11/01/09 – 11/30/09 2,431 6.63 — (b)
12/01/09 – 12/31/09 — — — (b)
Total 4,785 6.77 — (b)
(a) Shares withheld from employees to satisfy certain tax obligations due upon the vesting of restricted stock.
(b) Withholding of shares to satisfy tax obligations due upon the vesting of restricted stock in accordance with the Company’s share-based compensation plan.
The plan does not specify a maximum number of shares that may be repurchased.
33