United Airlines 2009 Annual Report Download - page 50
Download and view the complete annual report
Please find page 50 of the 2009 United Airlines annual report below. You can navigate through the pages in the report by either clicking on the pages listed below, or by using the keyword search tool below to find specific information within the annual report.-
 1
1 -
2
-
3
-
4
-
5
-
6
-
7
-
8
-
9
-
10
-
11
-
12
-
13
-
14
-
15
-
16
-
17
-
18
-
19
-
20
-
21
-
22
-
23
-
24
-
25
-
26
-
27
-
28
-
29
-
30
-
31
-
32
-
33
-
34
-
35
-
36
-
37
-
38
-
39
-
 40
40 -
 41
41 -
 42
42 -
 43
43 -
 44
44 -
 45
45 -
 46
46 -
 47
47 -
 48
48 -
 49
49 -
 50
50 -
 51
51 -
 52
52 -
 53
53 -
 54
54 -
 55
55 -
 56
56 -
 57
57 -
 58
58 -
 59
59 -
 60
60 -
61
-
62
-
63
-
64
-
65
-
66
-
67
-
68
-
69
-
70
-
71
-
72
-
73
-
74
-
75
-
76
-
77
-
78
-
79
-
80
-
81
-
82
-
83
-
84
-
85
-
86
-
87
-
88
-
89
-
90
-
91
-
92
-
93
-
94
-
95
-
96
-
97
-
98
-
99
-
100
-
101
-
102
-
103
-
104
-
105
-
106
-
107
-
108
-
109
-
110
-
111
-
112
-
113
-
114
-
115
-
116
-
117
-
118
-
119
-
120
-
121
-
122
-
123
-
124
-
125
-
126
-
127
-
128
-
129
-
130
-
131
-
132
-
133
-
134
-
135
-
136
-
137
-
138
-
139
-
140
-
141
-
142
-
143
-
144
-
145
-
146
-
147
-
148
-
149
-
150
-
151
-
152
-
153
-
154
-
155
-
156
-
157
-
158
-
159
-
160
-
161
-
162
-
163
-
164
-
165
-
166
-
167
-
168
-
169
-
170
-
171
-
172
-
173
-
174
-
175
-
176
 |
 |

Table of Contents
in Salaries and related costs. Salaries and related costs also decreased by $46 million due to the Company’s Success Sharing Program. The Company did not
record any expense for this plan in 2009. Partially offsetting these benefits were the impacts of average wage and benefit cost increases and a $38 million
increase related to on-time performance bonuses paid to operations employee groups during 2009, which were not paid in 2008.
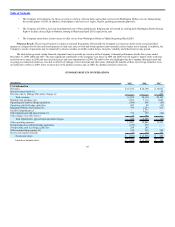
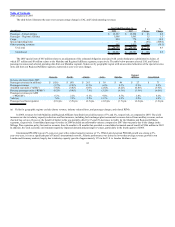
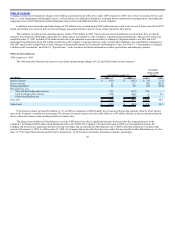
The decrease in jet fuel expense and Regional Affiliates expense was primarily attributable to decreased market prices for jet fuel, as shown in the table
below which presents the significant changes in Mainline and Regional Affiliate jet fuel cost per gallon in 2009 as compared to 2008. Lower Mainline fuel
consumption due to the capacity reductions also benefited Mainline fuel expense in 2009 as compared to the prior year. See Note 12, “Fair Value Measurements
and Derivative Instruments,” in the Footnotes for additional details regarding gains/losses from settled positions and unrealized gains and losses at the end of the
period. Derivative gains/losses are not allocated to Regional Affiliate fuel expense.
Average price per gallon (in cents)
Year Ended December 31,
(In millions, except per gallon) 2009 2008
%
Change 2009 2008
%
Change
Mainline fuel purchase cost $ 3,509 $ 7,114 (50.7) 180.7 326.0 (44.6)
Non-cash fuel hedge (gains) losses in Mainline fuel (586) 568 — (30.2) 26.0 —
Cash fuel hedge (gains) losses in Mainline fuel 482 40 NM 24.8 1.9 NM
Total Mainline fuel expense 3,405 7,722 (55.9) 175.3 353.9 (50.5)
Regional Affiliates fuel expense (a) 799 1,257 (36.4) 201.8 338.8 (40.4)
UAL system operating fuel expense $ 4,204 $ 8,979 (53.2) 179.8 351.7 (48.9)
Non-cash fuel hedge (gains) losses in nonoperating income (loss) (279) $ 279 —
Cash fuel hedge (gains) losses in nonoperating income (loss) 248 249 (0.4)
Mainline fuel consumption (gallons) 1,942 2,182 (11.0)
Regional Affiliates fuel consumption (gallons) 396 371 6.7
Total fuel consumption (gallons) 2,338 2,553 (8.4)
(a) Regional Affiliates fuel costs are classified as part of Regional Affiliates expense.
NM Not meaningful.
Regional Affiliates expense decreased $309 million, or 10%, during 2009 as compared to 2008 primarily due to a $458 million decrease in Regional
Affiliates fuel cost. The decrease in Regional Affiliates fuel cost was primarily due to a lower average price per gallon of Regional Affiliates jet fuel in 2009, as
presented in the table above, and was partially offset by increased fuel consumption as a result of the increase in Regional Affiliates capacity. Increased capacity
agreement payments to Regional Affiliates as a result of increased capacity, partially offset the net fuel benefit. The Regional Affiliates operating income was
$125 million in the 2009 period, as compared to a loss of $150 million in the 2008 period. Regional Affiliates operating results improved significantly on a
year-over-year basis as the benefits of increased traffic and lower fuel cost offset the yield decrease.
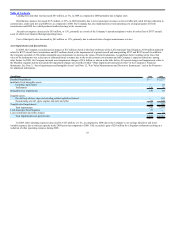
Purchased services decreased $208 million, or 15%, in 2009 as compared to 2008 primarily due to the Company’s operating cost savings programs and
lower variable costs associated with lower Mainline capacity.
During 2009, aircraft maintenance materials and outside repairs decreased by $131 million, or 12%, as compared to the prior year primarily due to a lower
volume of engine and airframe maintenance expense as a result of the Company’s early retirement of 100 aircraft from its operating fleet and the timing of
maintenance on other fleet types.
46