United Airlines 2009 Annual Report Download - page 104
Download and view the complete annual report
Please find page 104 of the 2009 United Airlines annual report below. You can navigate through the pages in the report by either clicking on the pages listed below, or by using the keyword search tool below to find specific information within the annual report.-
 1
1 -
2
-
3
-
4
-
5
-
6
-
7
-
8
-
9
-
10
-
11
-
12
-
13
-
14
-
15
-
16
-
17
-
18
-
19
-
20
-
21
-
22
-
23
-
24
-
25
-
26
-
27
-
28
-
29
-
30
-
31
-
32
-
33
-
34
-
35
-
36
-
37
-
38
-
39
-
40
-
41
-
42
-
43
-
44
-
45
-
46
-
47
-
48
-
49
-
50
-
51
-
52
-
53
-
54
-
55
-
56
-
57
-
58
-
59
-
60
-
61
-
62
-
63
-
64
-
65
-
66
-
67
-
68
-
69
-
70
-
71
-
72
-
73
-
74
-
75
-
76
-
77
-
78
-
79
-
80
-
81
-
82
-
83
-
84
-
85
-
86
-
87
-
88
-
89
-
90
-
91
-
92
-
93
-
 94
94 -
 95
95 -
 96
96 -
 97
97 -
 98
98 -
 99
99 -
 100
100 -
 101
101 -
 102
102 -
 103
103 -
 104
104 -
 105
105 -
 106
106 -
 107
107 -
 108
108 -
 109
109 -
 110
110 -
 111
111 -
 112
112 -
 113
113 -
 114
114 -
115
-
116
-
117
-
118
-
119
-
120
-
121
-
122
-
123
-
124
-
125
-
126
-
127
-
128
-
129
-
130
-
131
-
132
-
133
-
134
-
135
-
136
-
137
-
138
-
139
-
140
-
141
-
142
-
143
-
144
-
145
-
146
-
147
-
148
-
149
-
150
-
151
-
152
-
153
-
154
-
155
-
156
-
157
-
158
-
159
-
160
-
161
-
162
-
163
-
164
-
165
-
166
-
167
-
168
-
169
-
170
-
171
-
172
-
173
-
174
-
175
-
176
 |
 |

Table of Contents
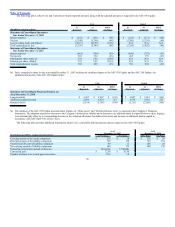
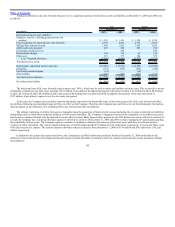
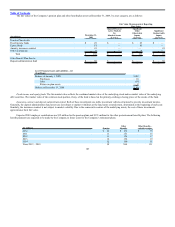
The following table provides additional information for options granted in each period:
Year Ended December 31,
Weighted-average fair value assumptions: 2009 2008 2007
Risk-free interest rate 1.9 – 3.1% 1.9 – 3.6% 3.4 – 5.0%
Dividend yield 0% 0% 0%
Expected market price volatility of UAL common stock 92.5% 55% 55%
Expected life of options (years) 6.0 5.0 – 6.3 5.8 – 6.2
Weighted-average fair value $ 3.72 $ 7.86 $ 25.13
The fair value of options was determined at the grant date using a Black Scholes option pricing model, which requires the Company to make several
assumptions. The risk-free interest rate is based on the U.S. treasury yield curve in effect for the expected term of the option at the time of grant. The dividend
yield on UAL’s common stock was assumed to be zero since UAL did not have any plans to pay dividends at the time of the option grants.
The volatility assumptions were based upon historical volatilities of comparable airlines whose shares are traded using daily stock price returns equivalent
to the contractual term of the option. In addition, implied volatility data for both UAL and comparable airlines, using current exchange-traded options, was
utilized.
The expected life of the options was determined based upon a simplified assumption that the option will be exercised evenly from vesting to expiration.
Options have a contractual term of ten years. Stock options granted in 2009 typically vest over a three year period and options granted prior to 2009, typically
vest over a four year period. The terms of the 2009 awards do not provide for the acceleration of vesting upon retirement. Under the MEIP, awards to employees
that are retirement eligible either at the grant date or within the vesting period are considered vested at the respective retirement eligibility date.
The fair value of the restricted stock awards was primarily based upon the share price on the date of grant. Restricted stock vesting is similar to the stock
option vesting described above. Approximately 2.2 million of the 2.5 million non-vested RSUs and restricted stock awards at December 31, 2009 are expected to
vest. The RSUs may be settled in cash or stock at the discretion of the Human Resources Subcommittee of the UAL Board of Directors. UAL’s intent is to settle
the RSUs in cash; therefore, the obligations related to these RSUs has been recognized in these Financial Statements.
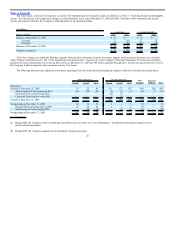
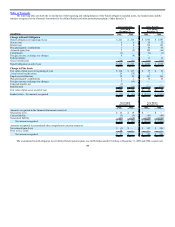
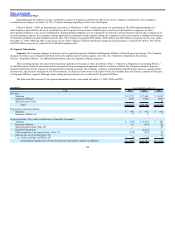
The table below summarizes UAL’s RSU and restricted stock activity for the twelve months ended December 31, 2009:
Restricted Stock Units
Weighted-
Average
Grant Price Restricted Stock
Weighted-
Average
Grant Price
Non-vested at beginning of year — $ — 1,430,675 $ 35.32
Granted 1,831,500 4.90 67,200 6.99
Vested — — (624,544) 33.94
Canceled (112,100) 4.86 (62,761) 36.05
Non-vested at end of year 1,719,400 4.90 810,570 27.82
The fair value of restricted shares vested in 2009, 2008 and 2007 was $21 million, $30 million and $28 million, respectively. The weighted-average grant
date price of restricted shares granted in 2008 and 2007 was $15.76 and $43.61, respectively.
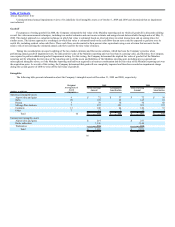
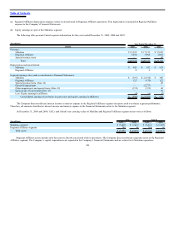
(7) Income Taxes
In 2009, UAL and United recorded a tax benefit of $17 million and $16 million, respectively, primarily due to the impairment of indefinite lived
intangibles partially offset by the income tax effects of items recorded in
100