United Airlines 2009 Annual Report Download - page 52
Download and view the complete annual report
Please find page 52 of the 2009 United Airlines annual report below. You can navigate through the pages in the report by either clicking on the pages listed below, or by using the keyword search tool below to find specific information within the annual report.-
 1
1 -
2
-
3
-
4
-
5
-
6
-
7
-
8
-
9
-
10
-
11
-
12
-
13
-
14
-
15
-
16
-
17
-
18
-
19
-
20
-
21
-
22
-
23
-
24
-
25
-
26
-
27
-
28
-
29
-
30
-
31
-
32
-
33
-
34
-
35
-
36
-
37
-
38
-
39
-
40
-
41
-
 42
42 -
 43
43 -
 44
44 -
 45
45 -
 46
46 -
 47
47 -
 48
48 -
 49
49 -
 50
50 -
 51
51 -
 52
52 -
 53
53 -
 54
54 -
 55
55 -
 56
56 -
 57
57 -
 58
58 -
 59
59 -
 60
60 -
 61
61 -
 62
62 -
63
-
64
-
65
-
66
-
67
-
68
-
69
-
70
-
71
-
72
-
73
-
74
-
75
-
76
-
77
-
78
-
79
-
80
-
81
-
82
-
83
-
84
-
85
-
86
-
87
-
88
-
89
-
90
-
91
-
92
-
93
-
94
-
95
-
96
-
97
-
98
-
99
-
100
-
101
-
102
-
103
-
104
-
105
-
106
-
107
-
108
-
109
-
110
-
111
-
112
-
113
-
114
-
115
-
116
-
117
-
118
-
119
-
120
-
121
-
122
-
123
-
124
-
125
-
126
-
127
-
128
-
129
-
130
-
131
-
132
-
133
-
134
-
135
-
136
-
137
-
138
-
139
-
140
-
141
-
142
-
143
-
144
-
145
-
146
-
147
-
148
-
149
-
150
-
151
-
152
-
153
-
154
-
155
-
156
-
157
-
158
-
159
-
160
-
161
-
162
-
163
-
164
-
165
-
166
-
167
-
168
-
169
-
170
-
171
-
172
-
173
-
174
-
175
-
176
 |
 |
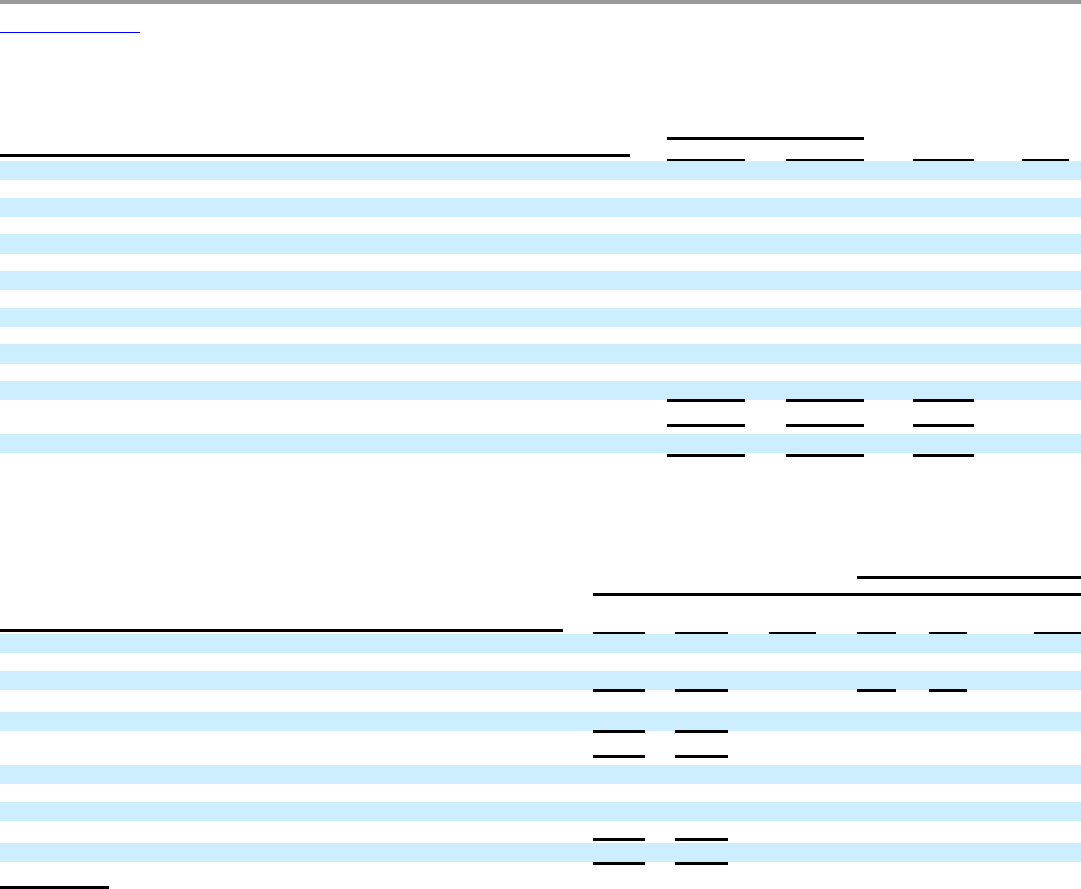
Table of Contents
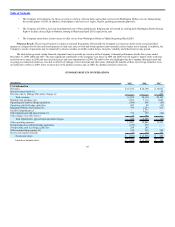
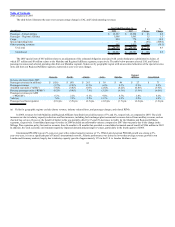
2008 compared to 2007
The table below includes data related to UAL and United operating expenses. Significant fluctuations are discussed below.
Year Ended December 31, $
Change
%
Change
(In millions) 2008 2007
Aircraft fuel $ 7,722 $ 5,003 $ 2,719 54.3
Salaries and related costs 4,311 4,261 50 1.2
Regional Affiliates 3,248 2,941 307 10.4
Purchased services 1,375 1,346 29 2.2
Aircraft maintenance materials and outside repairs 1,096 1,166 (70) (6.0)
Depreciation and amortization 932 925 7 0.8
Landing fees and other rent 862 876 (14) (1.6)
Distribution expenses 710 779 (69) (8.9)
Aircraft rent 409 406 3 0.7
Cost of third party sales 272 316 (44) (13.9)
Goodwill impairment 2,277 — 2,277 —
Other impairment and special items 339 (44) 383 —
Other operating expenses 1,079 1,131 (52) (4.6)
UAL total $ 24,632 $ 19,106 $ 5,526 28.9
United total $ 24,630 $ 19,099 $ 5,531 29.0
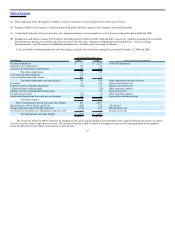
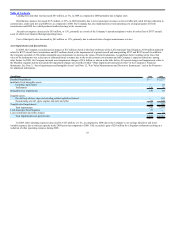
The increase in aircraft fuel expense and Regional Affiliates expense was primarily attributable to increased market prices for crude oil and related fuel
products as shown in table below, which presents several key variances for Mainline and Regional Affiliate aircraft fuel expense in 2008 as compared to 2007.
Average price per gallon (in cents)
Year Ended December 31,
(In millions, except per gallon) 2008 2007
%
Change 2008 2007
%
Change
Mainline fuel purchase cost $ 7,114 $ 5,086 39.9 326.0 221.9 46.9
Non-cash fuel hedge (gains) losses in mainline fuel 568 (20) — 26.0 (0.9) —
Cash fuel hedge (gains) losses in mainline fuel 40 (63) — 1.9 (2.7) —
Total Mainline fuel expense 7,722 5,003 54.3 353.9 218.3 62.1
Regional Affiliates fuel expense (a) 1,257 915 37.4 338.8 242.7 39.6
UAL system operating fuel expense $ 8,979 $ 5,918 51.7 351.7 221.7 58.6
Non-cash fuel hedge (gains) losses in nonoperating income (loss) $ 279 $ — —
Cash fuel hedge (gains) losses in nonoperating income (loss) 249 — —
Mainline fuel consumption (gallons) 2,182 2,292 (4.8)
Regional Affiliates fuel consumption (gallons) 371 377 (1.6)
Total fuel consumption (gallons) 2,553 2,669 (4.3)
(a) Regional Affiliates fuel costs are classified as part of Regional Affiliates expense.
Salaries and related costs increased $50 million in 2008. The Company’s costs in 2008 include increases in average wages and benefits expense, as well as
severance expense of $106 million due to the implementation of
48