United Airlines 2009 Annual Report Download - page 49
Download and view the complete annual report
Please find page 49 of the 2009 United Airlines annual report below. You can navigate through the pages in the report by either clicking on the pages listed below, or by using the keyword search tool below to find specific information within the annual report.-
 1
1 -
2
-
3
-
4
-
5
-
6
-
7
-
8
-
9
-
10
-
11
-
12
-
13
-
14
-
15
-
16
-
17
-
18
-
19
-
20
-
21
-
22
-
23
-
24
-
25
-
26
-
27
-
28
-
29
-
30
-
31
-
32
-
33
-
34
-
35
-
36
-
37
-
38
-
 39
39 -
 40
40 -
 41
41 -
 42
42 -
 43
43 -
 44
44 -
 45
45 -
 46
46 -
 47
47 -
 48
48 -
 49
49 -
 50
50 -
 51
51 -
 52
52 -
 53
53 -
 54
54 -
 55
55 -
 56
56 -
 57
57 -
 58
58 -
 59
59 -
60
-
61
-
62
-
63
-
64
-
65
-
66
-
67
-
68
-
69
-
70
-
71
-
72
-
73
-
74
-
75
-
76
-
77
-
78
-
79
-
80
-
81
-
82
-
83
-
84
-
85
-
86
-
87
-
88
-
89
-
90
-
91
-
92
-
93
-
94
-
95
-
96
-
97
-
98
-
99
-
100
-
101
-
102
-
103
-
104
-
105
-
106
-
107
-
108
-
109
-
110
-
111
-
112
-
113
-
114
-
115
-
116
-
117
-
118
-
119
-
120
-
121
-
122
-
123
-
124
-
125
-
126
-
127
-
128
-
129
-
130
-
131
-
132
-
133
-
134
-
135
-
136
-
137
-
138
-
139
-
140
-
141
-
142
-
143
-
144
-
145
-
146
-
147
-
148
-
149
-
150
-
151
-
152
-
153
-
154
-
155
-
156
-
157
-
158
-
159
-
160
-
161
-
162
-
163
-
164
-
165
-
166
-
167
-
168
-
169
-
170
-
171
-
172
-
173
-
174
-
175
-
176
 |
 |

Table of Contents
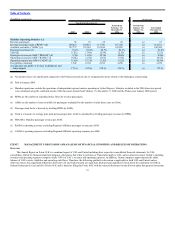
and United’s 15% growth in Germany. These markets account for approximately 75% of our Atlantic capacity. The Pacific region was impacted by 7% industry
capacity growth between the U.S. and China/Hong Kong, which account for approximately 45% of United’s Pacific capacity.
Cargo revenues increased by $84 million, or 11%, in 2008 as compared to 2007, primarily due to higher fuel surcharges and improved fleet utilization. In
addition, revenues were higher due to increased volume associated with the U.S. domestic mail contract, which commenced in late April 2007, as well as filling
new capacity in international markets. A weaker dollar also benefited cargo revenues in 2008 as a significant portion of cargo services are contracted in foreign
currencies. However, the Company experienced a significant decline in cargo revenues in the fourth quarter of 2008 due to rationalization of international
capacity, falling demand for domestic and international air cargo as the global economy softened, and lower fuel costs driving lower fuel surcharges. Decreased
cargo revenues resulting from lower demand have a disproportionate impact on our operating results because cargo revenues typically generate higher margins as
compared to passenger revenues.
Other revenues decreased approximately 11% in 2008 as compared to 2007. This decrease was primarily due to lower jet fuel sales to third parties. The
decrease in third party fuel sales had a negligible impact on our operating margin because the associated cost of sales decreased by a similar amount in 2008 as
compared to 2007.
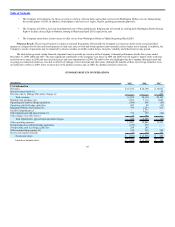
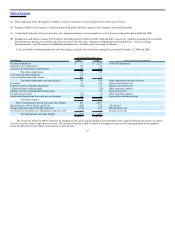
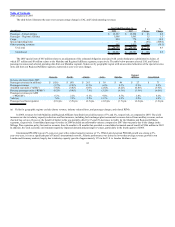
Operating Expenses.
2009 compared to 2008
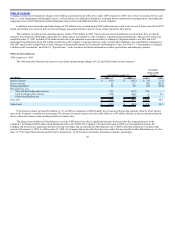
As discussed in Operating Revenues, above, the Company (decreased) increased Mainline and Regional Affiliates capacity by (10%) and 11%,
respectively, in 2009 as compared to 2008. The Mainline capacity reductions had a significantly favorable impact on certain of the Company’s Mainline
operating expenses, as further described below. Other significant fluctuations in the Company’s operating expenses are also discussed below. The table below
includes data related to UAL and United operating expenses.
Year Ended December 31, $
Change
%
Change
(In millions) 2009 2008
Salaries and related costs $ 3,773 $ 4,311 $ (538) (12.5)
Aircraft fuel 3,405 7,722 (4,317) (55.9)
Regional Affiliates 2,939 3,248 (309) (9.5)
Purchased services 1,167 1,375 (208) (15.1)
Aircraft maintenance materials and outside repairs 965 1,096 (131) (12.0)
Landing fees and other rent 905 862 43 5.0
Depreciation and amortization 902 932 (30) (3.2)
Distribution expenses 534 710 (176) (24.8)
Aircraft rent 346 409 (63) (15.4)
Cost of third party sales 230 272 (42) (15.4)
Goodwill impairment — 2,277 (2,277) (100.0)
Other impairment and special items 374 339 35 10.3
Other operating expenses 956 1,079 (123) (11.4)
UAL total $ 16,496 $ 24,632 $ (8,136) (33.0)
United total $ 16,496 $ 24,630 $ (8,134) (33.0)
Salaries and related costs decreased $538 million, or 13%, in 2009 as compared to 2008. The decrease was primarily due to the Company’s reduced
workforce in 2009 compared to 2008. The Company had approximately 43,700 average full-time equivalent employees for the year ended December 31, 2009 as
compared to 49,600 in the prior year. A $73 million decrease in severance expense related to the Company’s operational plans and a $92 million year-over-year
benefit due to changes in employee benefits expenses also contributed to the decrease
45