United Airlines 2009 Annual Report Download - page 167
Download and view the complete annual report
Please find page 167 of the 2009 United Airlines annual report below. You can navigate through the pages in the report by either clicking on the pages listed below, or by using the keyword search tool below to find specific information within the annual report.-
 1
1 -
2
-
3
-
4
-
5
-
6
-
7
-
8
-
9
-
10
-
11
-
12
-
13
-
14
-
15
-
16
-
17
-
18
-
19
-
20
-
21
-
22
-
23
-
24
-
25
-
26
-
27
-
28
-
29
-
30
-
31
-
32
-
33
-
34
-
35
-
36
-
37
-
38
-
39
-
40
-
41
-
42
-
43
-
44
-
45
-
46
-
47
-
48
-
49
-
50
-
51
-
52
-
53
-
54
-
55
-
56
-
57
-
58
-
59
-
60
-
61
-
62
-
63
-
64
-
65
-
66
-
67
-
68
-
69
-
70
-
71
-
72
-
73
-
74
-
75
-
76
-
77
-
78
-
79
-
80
-
81
-
82
-
83
-
84
-
85
-
86
-
87
-
88
-
89
-
90
-
91
-
92
-
93
-
94
-
95
-
96
-
97
-
98
-
99
-
100
-
101
-
102
-
103
-
104
-
105
-
106
-
107
-
108
-
109
-
110
-
111
-
112
-
113
-
114
-
115
-
116
-
117
-
118
-
119
-
120
-
121
-
122
-
123
-
124
-
125
-
126
-
127
-
128
-
129
-
130
-
131
-
132
-
133
-
134
-
135
-
136
-
137
-
138
-
139
-
140
-
141
-
142
-
143
-
144
-
145
-
146
-
147
-
148
-
149
-
150
-
151
-
152
-
153
-
154
-
155
-
156
-
 157
157 -
 158
158 -
 159
159 -
 160
160 -
 161
161 -
 162
162 -
 163
163 -
 164
164 -
 165
165 -
 166
166 -
 167
167 -
 168
168 -
 169
169 -
 170
170 -
 171
171 -
 172
172 -
 173
173 -
 174
174 -
 175
175 -
 176
176
 |
 |
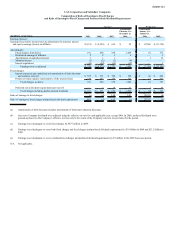
Exhibit 12.2
United Air Lines, Inc. and Subsidiary Companies
Computation of Ratio of Earnings to Fixed Charges
and Ratio of Earnings to Fixed Charges and Preferred Stock Dividend Requirements
Successor
Predecessor
Period from
February 1 to
December 31,
Period from
January 1 to
January 31,
(In millions, except ratios) 2009 2008 2007 2006
2006 2005
Earnings (losses):
Earnings (loss) before income taxes & adjustments for minority interest
and equity earnings (losses) in affiliates $ (647) $ (5,380) $ 653 $ 44 $ 22,620 $ (21,038)
Add (deduct):
Fixed charges, from below 911 869 938 1,071 64 786
Distributed earnings of affiliates 2 2 3 4 — 3
Amortization of capitalized interest 3 1 1 — 1 14
Minority interest (1) (2) (2) (4) — —
Interest capitalized (10) (20) (19) (15) — 3
Earnings (loss) as adjusted $ 258 $ (4,530) $ 1,574 $ 1,100 $ 22,685 $ (20,232)
Fixed charges:
Interest expensed and capitalized and amortization of debt discounts
and issuance costs (a) $ 577 $ 571 $ 703 $ 747 $ 42 $ 495
Portion of rental expense representative of the interest factor 334 298 235 324 22 291
Fixed charges, as above 911 869 938 1,071 64 786
Preferred stock dividend requirements (pre-tax) (b) — 3 18 29 — —
Fixed charges including preferred stock dividends $ 911 $ 872 $ 956 $ 1,100 $ 64 $ 786
Ratio of earnings to fixed charges (c) (d) 1.68 1.03 354.45 (d)
Ratio of earnings to fixed charges and preferred dividend requirements N/A (d) 1.65 1.00 N/A N/A
(a) Amortization of debt discounts includes amortization of fresh-start valuation discounts.
(b) Successor Company dividends were adjusted using the effective tax rate for each applicable year, except 2006. In 2006, preferred dividends were
grossed-up based on the Company’s effective tax rate only to the extent of the Company’s income tax provision for the period.
(c) Earnings were inadequate to cover fixed charges by $653 million and by $21.0 billion in 2005, respectively.
(d) Earnings were inadequate to cover both fixed charges and fixed charges and preferred dividend requirements by $5.4 billion in 2008.
N/A Not applicable.