United Airlines 2009 Annual Report Download - page 10
Download and view the complete annual report
Please find page 10 of the 2009 United Airlines annual report below. You can navigate through the pages in the report by either clicking on the pages listed below, or by using the keyword search tool below to find specific information within the annual report.-
 1
1 -
 2
2 -
 3
3 -
 4
4 -
 5
5 -
 6
6 -
 7
7 -
 8
8 -
 9
9 -
 10
10 -
 11
11 -
 12
12 -
 13
13 -
 14
14 -
 15
15 -
 16
16 -
 17
17 -
 18
18 -
 19
19 -
 20
20 -
 21
21 -
22
-
23
-
24
-
25
-
26
-
27
-
28
-
29
-
30
-
31
-
32
-
33
-
34
-
35
-
36
-
37
-
38
-
39
-
40
-
41
-
42
-
43
-
44
-
45
-
46
-
47
-
48
-
49
-
50
-
51
-
52
-
53
-
54
-
55
-
56
-
57
-
58
-
59
-
60
-
61
-
62
-
63
-
64
-
65
-
66
-
67
-
68
-
69
-
70
-
71
-
72
-
73
-
74
-
75
-
76
-
77
-
78
-
79
-
80
-
81
-
82
-
83
-
84
-
85
-
86
-
87
-
88
-
89
-
90
-
91
-
92
-
93
-
94
-
95
-
96
-
97
-
98
-
99
-
100
-
101
-
102
-
103
-
104
-
105
-
106
-
107
-
108
-
109
-
110
-
111
-
112
-
113
-
114
-
115
-
116
-
117
-
118
-
119
-
120
-
121
-
122
-
123
-
124
-
125
-
126
-
127
-
128
-
129
-
130
-
131
-
132
-
133
-
134
-
135
-
136
-
137
-
138
-
139
-
140
-
141
-
142
-
143
-
144
-
145
-
146
-
147
-
148
-
149
-
150
-
151
-
152
-
153
-
154
-
155
-
156
-
157
-
158
-
159
-
160
-
161
-
162
-
163
-
164
-
165
-
166
-
167
-
168
-
169
-
170
-
171
-
172
-
173
-
174
-
175
-
176
 |
 |
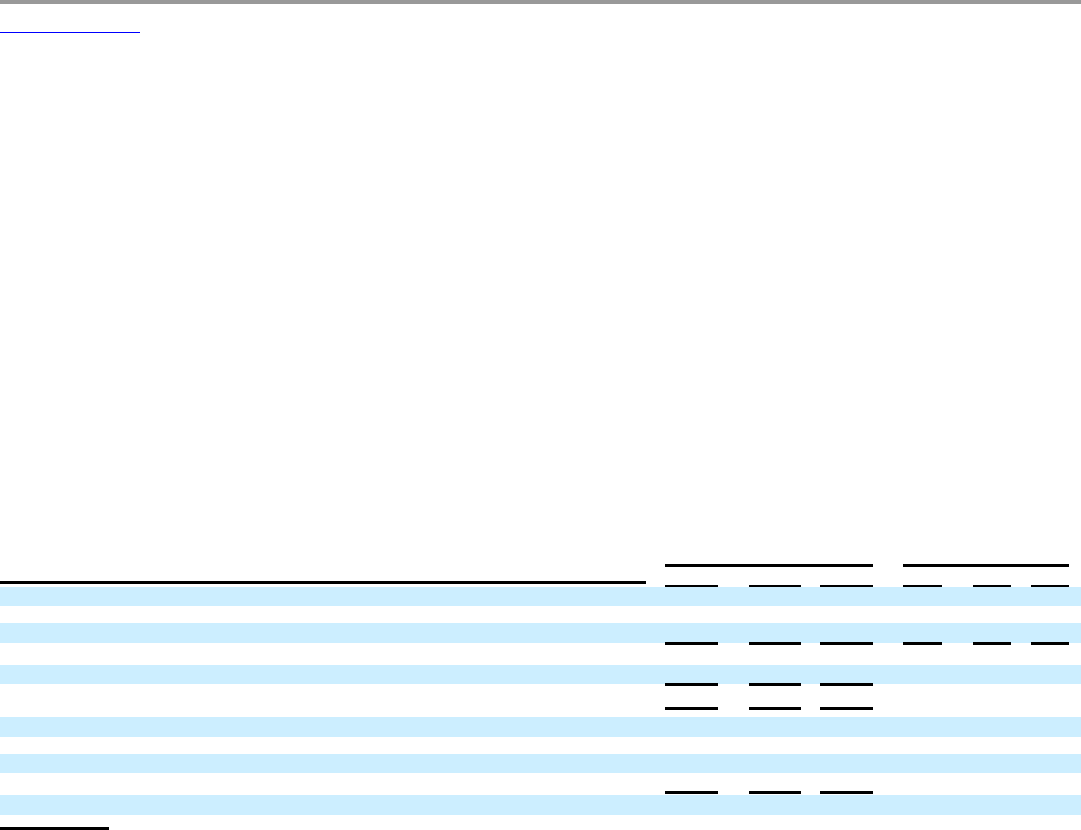
Table of Contents
services. United Services brings nearly 80 years of experience to serve over 100 airline customer contracts worldwide. During 2009 and 2008, United Services
generated approximately $134 million and $167 million, respectively, in third-party revenue.
Fuel. The price and availability of jet fuel significantly affects the Company’s results of operations. Fuel has been one of the Company’s largest operating
expenses for the last several years. The Company has a risk management strategy to hedge a portion of its price risk related to projected jet fuel requirements.
The Company’s hedging strategy currently utilizes purchased calls and swaps. If fuel prices rise above the fixed swap price, the Company’s counterparties are
required to make settlement payments to the Company, while if fuel prices fall below the fixed swap price, the Company is required to make settlement payments
to its fuel hedge counterparties. In addition, the Company has been, and may in the future be, required to provide counterparties with cash collateral prior to
settlement of the hedge positions.
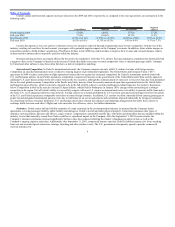
Fuel prices were extremely volatile during the three year period ended December 31, 2009, as shown in the table below. In 2009, the Company benefited
from a lower average purchase price as compared to the two prior years due to lower market prices for jet fuel. The Company’s operating results in 2008 were
adversely impacted by the unprecedented increase in the price of crude oil to a peak of approximately $145 per barrel in July 2008, followed by a decrease of
more than $100 per barrel to approximately $45 per barrel in December 2008. This volatility resulted in the Company reporting total fuel hedge losses of
approximately $1.1 billion in 2008. A significant portion of these losses was unrealized as of December 31, 2008 and the related contracts were settled in 2009,
as shown in the table below. Fuel prices were somewhat less volatile in 2009 and 2007, as compared to 2008, resulting in less significant hedge impacts in these
years. Total fuel hedge gains of $135 million and $83 million were reported in 2009 and 2007, respectively. The Company’s results of operations benefit from
lower fuel prices on its unhedged fuel consumption and its liquidity is subject to fluctuations based on cash settlements and collateral that may be required.
The Company accounts for the majority of its fuel derivative contracts as economic hedges, which are marked-to-market with gains and losses classified as
fuel expense. Remaining fuel derivative contracts which do not qualify for economic hedge accounting are marked-to-market with gains and losses classified as
nonoperating expense. See Item 7A, Quantitative and Qualitative Disclosures About Market Risk and Note 12, “Fair Value Measurements and Derivative
Instruments,” in the Footnotes for additional details regarding gains and losses from settled and open positions, cash settlements, unrealized amounts at the end of
the period and hedge collateral. Derivative gains and losses from contracts qualifying for economic hedge accounting are recorded in Mainline fuel expense and
are not allocated to Regional Affiliates fuel expense.
$
Average price per gallon
(in cents)
(In millions, except per gallon) 2009 2008 2007 2009 2008 2007
Mainline fuel purchase cost $ 3,509 $ 7,114 $ 5,086 180.7 326.0 221.9
Non-cash fuel hedge (gains) losses in Mainline fuel (586) 568 (20) (30.2) 26.0 (0.9)
Cash fuel hedge (gains) losses in Mainline fuel 482 40 (63) 24.8 1.9 (2.7)
Total Mainline fuel expense 3,405 7,722 5,003 175.3 353.9 218.3
Regional Affiliates fuel expense (a) 799 1,257 915 201.8 338.8 242.7
UAL system operating fuel expense $ 4,204 $ 8,979 $ 5,918 179.8 351.7 221.7
Non-cash fuel hedge (gains) losses in nonoperating income (expense) $ (279) $ 279 $ —
Cash fuel hedge losses in nonoperating income (expense) 248 249 —
Mainline fuel consumption (gallons) 1,942 2,182 2,292
Regional Affiliates fuel consumption (gallons) 396 371 377
Total fuel consumption (gallons) 2,338 2,553 2,669
(a) Regional Affiliates fuel costs are classified as part of Regional Affiliates expense.
6