United Airlines 2009 Annual Report Download - page 38
Download and view the complete annual report
Please find page 38 of the 2009 United Airlines annual report below. You can navigate through the pages in the report by either clicking on the pages listed below, or by using the keyword search tool below to find specific information within the annual report.-
 1
1 -
2
-
3
-
4
-
5
-
6
-
7
-
8
-
9
-
10
-
11
-
12
-
13
-
14
-
15
-
16
-
17
-
18
-
19
-
20
-
21
-
22
-
23
-
24
-
25
-
26
-
27
-
 28
28 -
 29
29 -
 30
30 -
 31
31 -
 32
32 -
 33
33 -
 34
34 -
 35
35 -
 36
36 -
 37
37 -
 38
38 -
 39
39 -
 40
40 -
 41
41 -
 42
42 -
 43
43 -
 44
44 -
 45
45 -
 46
46 -
 47
47 -
 48
48 -
49
-
50
-
51
-
52
-
53
-
54
-
55
-
56
-
57
-
58
-
59
-
60
-
61
-
62
-
63
-
64
-
65
-
66
-
67
-
68
-
69
-
70
-
71
-
72
-
73
-
74
-
75
-
76
-
77
-
78
-
79
-
80
-
81
-
82
-
83
-
84
-
85
-
86
-
87
-
88
-
89
-
90
-
91
-
92
-
93
-
94
-
95
-
96
-
97
-
98
-
99
-
100
-
101
-
102
-
103
-
104
-
105
-
106
-
107
-
108
-
109
-
110
-
111
-
112
-
113
-
114
-
115
-
116
-
117
-
118
-
119
-
120
-
121
-
122
-
123
-
124
-
125
-
126
-
127
-
128
-
129
-
130
-
131
-
132
-
133
-
134
-
135
-
136
-
137
-
138
-
139
-
140
-
141
-
142
-
143
-
144
-
145
-
146
-
147
-
148
-
149
-
150
-
151
-
152
-
153
-
154
-
155
-
156
-
157
-
158
-
159
-
160
-
161
-
162
-
163
-
164
-
165
-
166
-
167
-
168
-
169
-
170
-
171
-
172
-
173
-
174
-
175
-
176
 |
 |
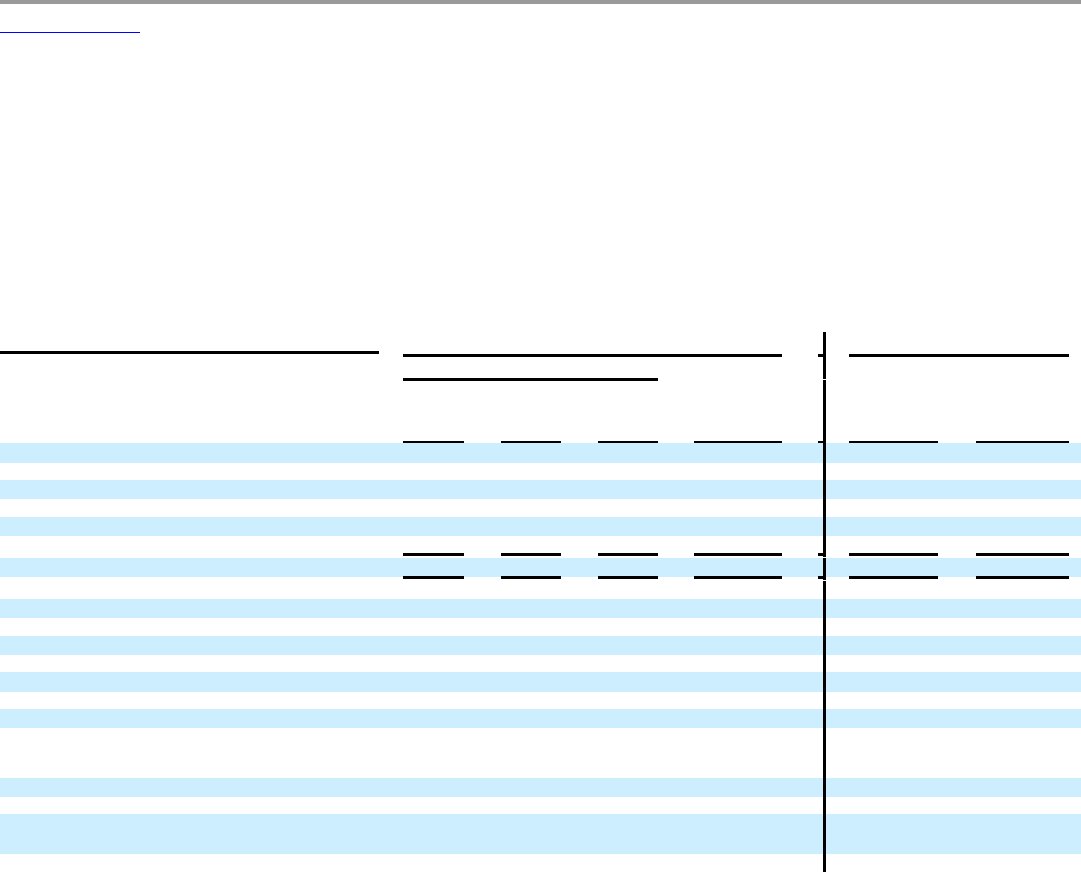
Table of Contents
PART II
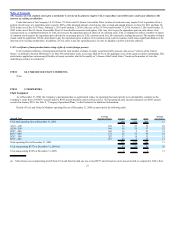
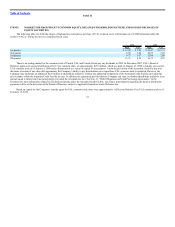
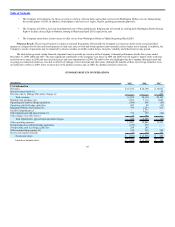
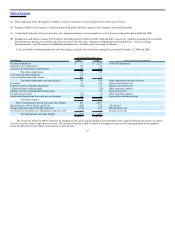
ITEM 6. SELECTED FINANCIAL DATA.
In connection with its emergence from Chapter 11 bankruptcy protection, UAL adopted fresh-start reporting, effective February 1, 2006, in accordance
with accounting principles related to reorganizations. As a result of the adoption of fresh-start reporting, the financial statements prior to February 1, 2006 are not
comparable with the financial statements after February 1, 2006. References to “Successor Company” refer to UAL on or after February 1, 2006, after giving
effect to the adoption of fresh-start reporting. References to “Predecessor Company” refer to UAL prior to February 1, 2006. Certain income statement and
balance sheet amounts presented in the table below for the 2008, 2007 and 2006 Successor periods include the impact from the Company’s 2009 retrospective
adoption of the new accounting principles related to accounting for convertible debt instruments that may be settled in cash upon conversion and determining
whether instruments granted in share-based payment transactions are participating securities for purposes of calculating earnings per share. See Note 1 (p),
“Summary of Significant Accounting Policies—New Accounting Pronouncements,” in the Footnotes for additional information.
(In millions, except rates) Successor Predecessor
Year Ended December 31,
2009 2008 2007
Period from
February 1 to
December 31,
2006
Period from
January 1 to
January 31,
2006
Year Ended
December 31,
2005
Income Statement Data:
Operating revenues $ 16,335 $ 20,194 $ 20,143 $ 17,882 $ 1,458 $ 17,379
Operating expenses 16,496 24,632 19,106 17,383 1,510 17,598
Mainline fuel purchase cost 3,509 7,114 5,086 4,436 362 4,032
Non-cash fuel hedge (gains) losses (586) 568 (20) 2 — —
Cash fuel hedge (gains) losses 482 40 (63) 24 — —
Total Mainline fuel expense 3,405 7,722 5,003 4,462 362 4,032
Nonoperating non-cash fuel hedge (gains) losses (279) 279 — — — —
Nonoperating cash fuel hedge (gains) losses 248 249 — — — —
Goodwill impairment — 2,277 — — — —
Other impairments and special operating items 374 339 (44) (36) — 18
Reorganization (income) expense — — — — (22,934) 20,601
Net income (loss) (a) (651) (5,396) 360 7 22,851 (21,176)
Basic earnings (loss) per share (4.32) (42.59) 2.94 (0.02) 196.61 (182.29)
Diluted earnings (loss) per share (4.32) (42.59) 2.65 (0.02) 196.61 (182.29)
Cash distribution declared per common share (b) — — 2.15 — — —
Balance Sheet Data at period-end:
Total assets $ 18,684 $ 19,465 $ 24,223 $ 25,372 $ 19,555 $ 19,342
Long-term debt and capital lease
obligations, including current portion 8,543 8,004 8,255 10,364 1,432 1,433
Liabilities subject to compromise — — — — 36,336 35,016
34