United Airlines 2009 Annual Report Download - page 112
Download and view the complete annual report
Please find page 112 of the 2009 United Airlines annual report below. You can navigate through the pages in the report by either clicking on the pages listed below, or by using the keyword search tool below to find specific information within the annual report.-
 1
1 -
2
-
3
-
4
-
5
-
6
-
7
-
8
-
9
-
10
-
11
-
12
-
13
-
14
-
15
-
16
-
17
-
18
-
19
-
20
-
21
-
22
-
23
-
24
-
25
-
26
-
27
-
28
-
29
-
30
-
31
-
32
-
33
-
34
-
35
-
36
-
37
-
38
-
39
-
40
-
41
-
42
-
43
-
44
-
45
-
46
-
47
-
48
-
49
-
50
-
51
-
52
-
53
-
54
-
55
-
56
-
57
-
58
-
59
-
60
-
61
-
62
-
63
-
64
-
65
-
66
-
67
-
68
-
69
-
70
-
71
-
72
-
73
-
74
-
75
-
76
-
77
-
78
-
79
-
80
-
81
-
82
-
83
-
84
-
85
-
86
-
87
-
88
-
89
-
90
-
91
-
92
-
93
-
94
-
95
-
96
-
97
-
98
-
99
-
100
-
101
-
 102
102 -
 103
103 -
 104
104 -
 105
105 -
 106
106 -
 107
107 -
 108
108 -
 109
109 -
 110
110 -
 111
111 -
 112
112 -
 113
113 -
 114
114 -
 115
115 -
 116
116 -
 117
117 -
 118
118 -
 119
119 -
 120
120 -
 121
121 -
 122
122 -
123
-
124
-
125
-
126
-
127
-
128
-
129
-
130
-
131
-
132
-
133
-
134
-
135
-
136
-
137
-
138
-
139
-
140
-
141
-
142
-
143
-
144
-
145
-
146
-
147
-
148
-
149
-
150
-
151
-
152
-
153
-
154
-
155
-
156
-
157
-
158
-
159
-
160
-
161
-
162
-
163
-
164
-
165
-
166
-
167
-
168
-
169
-
170
-
171
-
172
-
173
-
174
-
175
-
176
 |
 |

Table of Contents
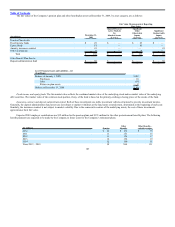
Defined Contribution Plans
Depending upon the employee group, contributions consist of matching contributions and/or non-elective employer contributions. The Company’s
contribution percentages vary from 1 to 16% of eligible earnings depending on the terms of each plan.
Effective March 1, 2006, an International Association of Machinists (“IAM”) replacement plan was implemented. The IAM replacement plan is a
multi-employer plan whereby the assets contributed by the Company (based on hours worked) may be used to provide benefits to employees of other
participating companies, since assets contributed by all participating companies are not segregated or restricted to provide benefits specifically to employees of
one participating company. In accordance with the applicable accounting for multi-employer plans, the Company would only recognize a withdrawal obligation
if it becomes probable it would withdraw from the plan. The Company recognized $244 million, $248 million and $232 million of expense for the years ended
December 31, 2009, 2008 and 2007, respectively, for all of the Company’s defined contribution employee retirement plans, of which $34 million, $34 million
and $28 million, respectively, related to the IAM multi-employer plan.
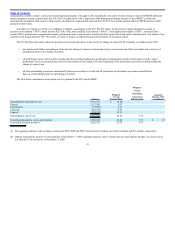
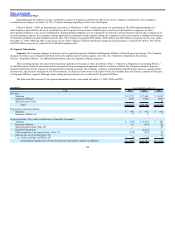
(9) Segment Information
Segments. The Company manages its business by two reporting segments: Mainline and Regional Affiliates (United Express operations). The Company
manages its business as an integrated network with assets deployed across various regions. See Note 1(i), “Summary of Significant Accounting
Policies—Regional Affiliates,” for additional information related to Regional Affiliates expenses.
The accounting policies for each of these reporting segments are the same as those described in Note 1, “Summary of Significant Accounting Policies,”
except that segment financial information has been prepared using a management approach which is consistent with how the Company internally disperses
financial information for the purpose of making internal operating decisions. The Company evaluates segment financial performance based on earnings before
income taxes, special items and gain on sale of investments. As discussed in the notes to the tables below, the Company does not allocate corporate overhead to
its Regional Affiliates segment; although certain selling and operational costs are allocated to Regional Affiliates.
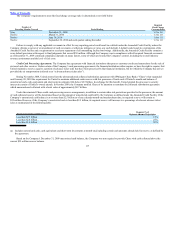
The following table presents UAL segment information for the years ended December 31, 2009, 2008 and 2007:
(In millions) Year Ended December 31,
UAL 2009 2008 2007
Revenue:
Mainline $ 13,271 $ 17,096 $ 17,035
Regional Affiliates 3,064 3,098 3,063
Special revenue items — — 45
Total $ 16,335 $ 20,194 $ 20,143
Depreciation and amortization:
Mainline $ 902 $ 932 $ 925
Regional Affiliates (a) 8 6 9
Segment earnings (loss) and reconciliation to Financial Statements:
Mainline $ (419) $ (2,655) $ 405
Regional Affiliates 125 (150) 122
Special revenue items (Note 18) — — 45
Goodwill impairment — (2,277) —
Other impairments and special items (Note 18) (374) (339) 44
Gain on sale of investment (Note 19) — — 41
Less: Equity earnings in affiliates (b) (4) (6) (5)
Consolidated earnings (loss) before income taxes and equity earnings in affiliates) $ (672) $ (5,427) $ 652
108