United Airlines 2009 Annual Report Download - page 105
Download and view the complete annual report
Please find page 105 of the 2009 United Airlines annual report below. You can navigate through the pages in the report by either clicking on the pages listed below, or by using the keyword search tool below to find specific information within the annual report.-
 1
1 -
2
-
3
-
4
-
5
-
6
-
7
-
8
-
9
-
10
-
11
-
12
-
13
-
14
-
15
-
16
-
17
-
18
-
19
-
20
-
21
-
22
-
23
-
24
-
25
-
26
-
27
-
28
-
29
-
30
-
31
-
32
-
33
-
34
-
35
-
36
-
37
-
38
-
39
-
40
-
41
-
42
-
43
-
44
-
45
-
46
-
47
-
48
-
49
-
50
-
51
-
52
-
53
-
54
-
55
-
56
-
57
-
58
-
59
-
60
-
61
-
62
-
63
-
64
-
65
-
66
-
67
-
68
-
69
-
70
-
71
-
72
-
73
-
74
-
75
-
76
-
77
-
78
-
79
-
80
-
81
-
82
-
83
-
84
-
85
-
86
-
87
-
88
-
89
-
90
-
91
-
92
-
93
-
94
-
 95
95 -
 96
96 -
 97
97 -
 98
98 -
 99
99 -
 100
100 -
 101
101 -
 102
102 -
 103
103 -
 104
104 -
 105
105 -
 106
106 -
 107
107 -
 108
108 -
 109
109 -
 110
110 -
 111
111 -
 112
112 -
 113
113 -
 114
114 -
 115
115 -
116
-
117
-
118
-
119
-
120
-
121
-
122
-
123
-
124
-
125
-
126
-
127
-
128
-
129
-
130
-
131
-
132
-
133
-
134
-
135
-
136
-
137
-
138
-
139
-
140
-
141
-
142
-
143
-
144
-
145
-
146
-
147
-
148
-
149
-
150
-
151
-
152
-
153
-
154
-
155
-
156
-
157
-
158
-
159
-
160
-
161
-
162
-
163
-
164
-
165
-
166
-
167
-
168
-
169
-
170
-
171
-
172
-
173
-
174
-
175
-
176
 |
 |

Table of Contents
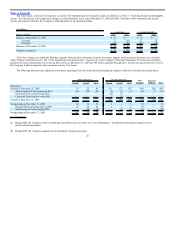
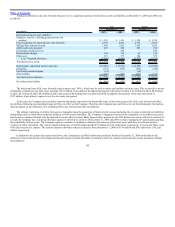
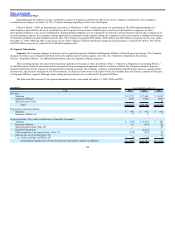
other comprehensive income. In 2008, UAL and United recorded tax benefits of $25 million and $22 million, respectively, primarily due to the impairment and
sale of select indefinite-lived intangibles and the impact of an increase in state tax rates. This tax benefit is small relative to the Company’s losses; consequently,
the Company’s effective tax rate is insignificant, when compared to the 35% U.S. federal statutory rate. In 2007, the Company’s regular taxable income was
completely absorbed by utilization of its net operating loss (“NOL”) carry forward; however, the Company did incur an alternative minimum tax (“AMT”)
liability of $6 million.
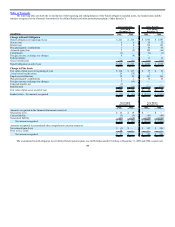
The significant components of the income tax expense (benefit) are as follows:
(In millions) Year Ended December 31,
UAL 2009 2008 2007
Current tax expense (benefit) $ (1) $ 1 $ 6
Deferred tax expense (benefit) (16) (26) 291
$ (17) $ (25) $ 297
United
Current tax expense $ — $ 4 $ 6
Deferred tax expense (benefit) (16) (26) 290
$ (16) $ (22) $ 296
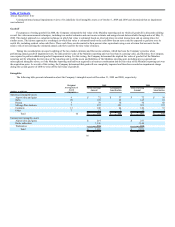
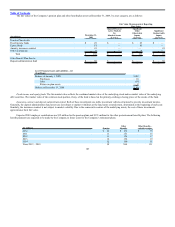
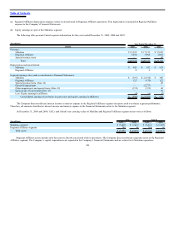
The income tax provision differed from amounts computed at the statutory federal income tax rate, as follows:
(In millions) Year Ended December 31,
UAL 2009 2008 2007
Income tax provision at statutory rate $ (234) $ (1,896) $ 229
State income taxes, net of federal income tax benefit 5 (68) 12
Goodwill — 798 —
Nondeductible employee meals 6 7 10
Nondeductible interest expense 12 10 21
Medicare Part D Subsidy (7) (12) (2)
Valuation allowance 190 1,117 15
Share-based compensation 7 — 2
Rate change beginning deferreds — 14 —
Other, net 4 5 10
$ (17) $ (25) $ 297
(In millions) Year Ended December 31,
United 2009 2008 2007
Income tax provision at statutory rate $ (225) $ (1,882) $ 229
State income taxes, net of federal income tax benefit 6 (67) 12
Goodwill — 798 —
Nondeductible employee meals 6 7 10
Nondeductible interest expense 12 10 21
Medicare Part D Subsidy (7) (12) (2)
Valuation allowance 182 1,101 15
Share-based compensation 7 — 2
Rate change beginning deferreds — 14 —
Other, net 3 9 9
$ (16) $ (22) $ 296
101