United Airlines 2009 Annual Report Download - page 40
Download and view the complete annual report
Please find page 40 of the 2009 United Airlines annual report below. You can navigate through the pages in the report by either clicking on the pages listed below, or by using the keyword search tool below to find specific information within the annual report.-
 1
1 -
2
-
3
-
4
-
5
-
6
-
7
-
8
-
9
-
10
-
11
-
12
-
13
-
14
-
15
-
16
-
17
-
18
-
19
-
20
-
21
-
22
-
23
-
24
-
25
-
26
-
27
-
28
-
29
-
 30
30 -
 31
31 -
 32
32 -
 33
33 -
 34
34 -
 35
35 -
 36
36 -
 37
37 -
 38
38 -
 39
39 -
 40
40 -
 41
41 -
 42
42 -
 43
43 -
 44
44 -
 45
45 -
 46
46 -
 47
47 -
 48
48 -
 49
49 -
 50
50 -
51
-
52
-
53
-
54
-
55
-
56
-
57
-
58
-
59
-
60
-
61
-
62
-
63
-
64
-
65
-
66
-
67
-
68
-
69
-
70
-
71
-
72
-
73
-
74
-
75
-
76
-
77
-
78
-
79
-
80
-
81
-
82
-
83
-
84
-
85
-
86
-
87
-
88
-
89
-
90
-
91
-
92
-
93
-
94
-
95
-
96
-
97
-
98
-
99
-
100
-
101
-
102
-
103
-
104
-
105
-
106
-
107
-
108
-
109
-
110
-
111
-
112
-
113
-
114
-
115
-
116
-
117
-
118
-
119
-
120
-
121
-
122
-
123
-
124
-
125
-
126
-
127
-
128
-
129
-
130
-
131
-
132
-
133
-
134
-
135
-
136
-
137
-
138
-
139
-
140
-
141
-
142
-
143
-
144
-
145
-
146
-
147
-
148
-
149
-
150
-
151
-
152
-
153
-
154
-
155
-
156
-
157
-
158
-
159
-
160
-
161
-
162
-
163
-
164
-
165
-
166
-
167
-
168
-
169
-
170
-
171
-
172
-
173
-
174
-
175
-
176
 |
 |

Table of Contents
As discussed above under Item 1, Business, the Company derives virtually all of its revenues from airline related activities. The most significant source of
airline revenues is passenger revenues; however, Mileage Plus, United Cargo and United Services are also major sources of operating revenues. The airline
industry is highly competitive and is characterized by intense price competition. Fare discounting by United’s competitors has historically had a negative effect
on the Company’s financial results because United has generally been required to match competitors’ fares to maintain passenger traffic. Future competitive fare
adjustments may negatively impact the Company’s future financial results. One of the Company’s most significant operating expenses is jet fuel. Jet fuel prices
are extremely volatile and are largely uncontrollable by the Company. The Company’s historical and future earnings have been, and will continue to be,
significantly impacted by jet fuel prices.
The Company continues to implement its “Focus on Five” business approach, a comprehensive set of priorities that focuses on the fundamentals of
running a good airline: one that runs on time, with clean planes and courteous employees, delivers industry-leading revenues and competitive costs, and does so
safely. The goal of this approach is to enable United to achieve best-in-class safety performance, exceptional customer satisfaction and experience, and
industry-leading margin and cash flow. During 2009, United’s positions with respect to certain key metrics reported by the DOT improved significantly. In
addition to improvements in overall customer satisfaction scores, United ranked number one in on-time performance for domestic scheduled flights for 2009
among the five largest global U.S. based carriers, as measured by the DOT and as published in the Air Travel Consumer Report for 2009. The Company also
reduced unit costs through cost control initiatives and successfully completed a number of financing initiatives during 2009 to strengthen its liquidity and
considerably reduce its near-term scheduled debt payments.
Recent Developments. The global recession created an extremely challenging environment for the Company. For most of 2008 and 2009, the airline
industry experienced decreased demand for air travel which put pressure on the Company’s operating cash reserves, as well as its operating revenues. Despite
challenging revenue conditions, the Company significantly reduced its year-over-year operating expenses. In addition to fuel price declines and reduced capacity,
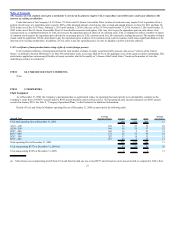
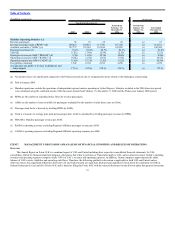
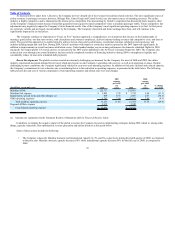
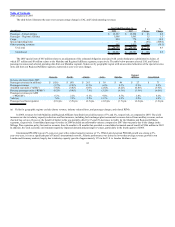
the Company’s commitment to cost reduction was a contributing factor to this reduction in operating expenses, as presented in the table below. The following
table presents the unit cost of various components of total operating expenses and related year-over-year changes.
(In millions, except unit costs) 2009
2009
expense
per ASM
(in
cents) 2008
2008
expense
per ASM
(in
cents)
% change
per ASM
Mainline ASMs 122,737 135,861
Mainline fuel expense $ 3,405 2.78 $ 7,722 5.68 (51.1)
Impairments, special items and other charges (a) 409 0.33 2,807 2.07 (84.1)
Other operating expenses 9,743 7.94 10,855 7.99 (0.6)
Total mainline operating expense 13,557 11.05 21,384 15.74 (29.8)
Regional affiliate expense 2,939 3,248
Consolidated operating expense $ 16,496 $ 24,632
(a) Amounts are summarized in the Summary Results of Operations table in Financial Results, below.
In addition, to mitigate the negative impact of the global recession, the Company focused on implementing strategies during 2009 related to, among other
things, capacity reductions, fleet optimization, revenue generation and airline alliances as discussed below.
Some of these actions include the following:
• The Company reduced its Mainline domestic and international capacity by 5% and 8%, respectively, during the fourth quarter of 2009, as compared
to the prior year. Mainline domestic capacity decreased 10% while international capacity decreased 9% for the full year of 2009, as compared to
2008.
36