United Airlines 2009 Annual Report Download - page 58
Download and view the complete annual report
Please find page 58 of the 2009 United Airlines annual report below. You can navigate through the pages in the report by either clicking on the pages listed below, or by using the keyword search tool below to find specific information within the annual report.-
 1
1 -
2
-
3
-
4
-
5
-
6
-
7
-
8
-
9
-
10
-
11
-
12
-
13
-
14
-
15
-
16
-
17
-
18
-
19
-
20
-
21
-
22
-
23
-
24
-
25
-
26
-
27
-
28
-
29
-
30
-
31
-
32
-
33
-
34
-
35
-
36
-
37
-
38
-
39
-
40
-
41
-
42
-
43
-
44
-
45
-
46
-
47
-
 48
48 -
 49
49 -
 50
50 -
 51
51 -
 52
52 -
 53
53 -
 54
54 -
 55
55 -
 56
56 -
 57
57 -
 58
58 -
 59
59 -
 60
60 -
 61
61 -
 62
62 -
 63
63 -
 64
64 -
 65
65 -
 66
66 -
 67
67 -
 68
68 -
69
-
70
-
71
-
72
-
73
-
74
-
75
-
76
-
77
-
78
-
79
-
80
-
81
-
82
-
83
-
84
-
85
-
86
-
87
-
88
-
89
-
90
-
91
-
92
-
93
-
94
-
95
-
96
-
97
-
98
-
99
-
100
-
101
-
102
-
103
-
104
-
105
-
106
-
107
-
108
-
109
-
110
-
111
-
112
-
113
-
114
-
115
-
116
-
117
-
118
-
119
-
120
-
121
-
122
-
123
-
124
-
125
-
126
-
127
-
128
-
129
-
130
-
131
-
132
-
133
-
134
-
135
-
136
-
137
-
138
-
139
-
140
-
141
-
142
-
143
-
144
-
145
-
146
-
147
-
148
-
149
-
150
-
151
-
152
-
153
-
154
-
155
-
156
-
157
-
158
-
159
-
160
-
161
-
162
-
163
-
164
-
165
-
166
-
167
-
168
-
169
-
170
-
171
-
172
-
173
-
174
-
175
-
176
 |
 |

Table of Contents
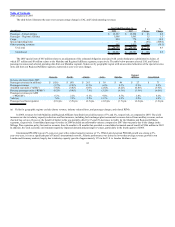
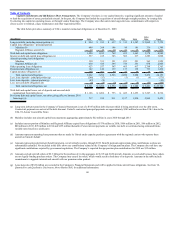
costs decreased by $4.1 billion in 2009, as compared to 2008. Decreases in the Company’s fuel hedge collateral requirements also provided operating cash of
approximately $955 million in 2009, as compared to a use of cash of $965 million in 2008. In addition, the Company received $160 million during 2009 related
to the future relocation of its O’Hare cargo facility as further discussed in Note 14, “Lease Obligations,” in the Footnotes.
These operating cash flow benefits were partially offset by a decrease in operating cash flow due to lower sales, which decreased by $3.9 billion in 2009,
as discussed in Results of Operations, above, and approximately $730 million of payments to counterparties for fuel derivative contract settlements and
premiums. In addition, the Company did not have a significant advance sale of miles in 2009 resulting in an unfavorable variance as compared to 2008, during
which the Company received $600 million from the Company’s advanced sale of miles and license agreement with its co-branded credit card partner, as
discussed below.
In 2009, the Company contributed approximately $245 million and $18 million to its defined contribution plans and non-U.S. pension plans, respectively,
as compared to contributions of $240 million and $22 million, respectively, in 2008.
2008 compared to 2007
UAL’s cash from operations decreased by $3.4 billion in 2008 as compared to 2007. This decrease was primarily due to the increased cash required for
fuel purchases and operating and nonoperating cash fuel hedge losses. Mainline and Regional Affiliates fuel costs increased $3.1 billion in 2008, over 2007, and
nonoperating expenses also increased over the same period largely due to cash and non-cash fuel hedge losses. In addition, certain counterparties to our fuel
hedge instruments required the Company to provide cash collateral deposits of approximately $965 million in 2008, which negatively impacted our cash flows
during 2008 as compared to 2007, when no similar deposits were required. A decrease in advance ticket sales also negatively impacted operating cash flow in
2008. Partially offsetting the negative impacts were $500 million of proceeds from the advanced purchase of miles by our co-branded credit card partner as part
of the amendment of our marketing agreement and $100 million of proceeds from the extension of the license previously granted to our co-branded credit card
partner to be the exclusive issuer of Mileage Plus Visa cards through 2017. In 2008, the Company contributed approximately $240 million and $22 million to its
defined contribution plans and non-U.S. pension plans, respectively, as compared to contributions of $236 million and $14 million, respectively, in 2007 for
these plans.
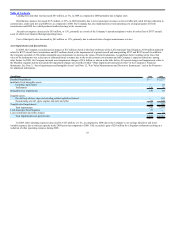
Cash Flows from Investing Activities.
2009 compared to 2008
The sale of $2.3 billion of short-term investments throughout 2008 generated significant investing cash flows in 2008 as compared to 2009. As discussed
below, these investments were sold as part of the Company’s shift to invest available cash into money market funds. UAL’s capital expenditures, which included
capitalized interest, were $317 million and $475 million in 2009 and 2008, respectively. Capital expenditures decreased significantly in the 2009 period as
compared to 2008 because the Company only acquired one aircraft in 2009, as compared to ten aircraft acquired during 2008. In addition, the Company limited
its spending in 2009 by focusing its capital resources only on its highest-value projects. The 2009 and 2008 aircraft acquisitions were completed pursuant to
existing lease terms using pre-funded lease deposits, as described below in Cash Flows from Financing Activities.
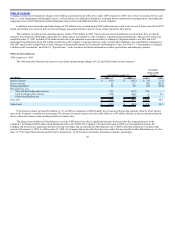
In 2009, the Company received $175 million from three sale-leaseback agreements. These transactions were accounted for as capital leases, resulting in an
increase to capital lease assets and capital lease obligations during 2009. The 2008 period included proceeds of $274 million from one sale-leaseback transaction.
Other asset sales, including airport slot sales, generated proceeds of $78 million and $94 million during 2009 and 2008, respectively.
54