United Airlines 2009 Annual Report Download - page 48
Download and view the complete annual report
Please find page 48 of the 2009 United Airlines annual report below. You can navigate through the pages in the report by either clicking on the pages listed below, or by using the keyword search tool below to find specific information within the annual report.-
 1
1 -
2
-
3
-
4
-
5
-
6
-
7
-
8
-
9
-
10
-
11
-
12
-
13
-
14
-
15
-
16
-
17
-
18
-
19
-
20
-
21
-
22
-
23
-
24
-
25
-
26
-
27
-
28
-
29
-
30
-
31
-
32
-
33
-
34
-
35
-
36
-
37
-
 38
38 -
 39
39 -
 40
40 -
 41
41 -
 42
42 -
 43
43 -
 44
44 -
 45
45 -
 46
46 -
 47
47 -
 48
48 -
 49
49 -
 50
50 -
 51
51 -
 52
52 -
 53
53 -
 54
54 -
 55
55 -
 56
56 -
 57
57 -
 58
58 -
59
-
60
-
61
-
62
-
63
-
64
-
65
-
66
-
67
-
68
-
69
-
70
-
71
-
72
-
73
-
74
-
75
-
76
-
77
-
78
-
79
-
80
-
81
-
82
-
83
-
84
-
85
-
86
-
87
-
88
-
89
-
90
-
91
-
92
-
93
-
94
-
95
-
96
-
97
-
98
-
99
-
100
-
101
-
102
-
103
-
104
-
105
-
106
-
107
-
108
-
109
-
110
-
111
-
112
-
113
-
114
-
115
-
116
-
117
-
118
-
119
-
120
-
121
-
122
-
123
-
124
-
125
-
126
-
127
-
128
-
129
-
130
-
131
-
132
-
133
-
134
-
135
-
136
-
137
-
138
-
139
-
140
-
141
-
142
-
143
-
144
-
145
-
146
-
147
-
148
-
149
-
150
-
151
-
152
-
153
-
154
-
155
-
156
-
157
-
158
-
159
-
160
-
161
-
162
-
163
-
164
-
165
-
166
-
167
-
168
-
169
-
170
-
171
-
172
-
173
-
174
-
175
-
176
 |
 |

Table of Contents
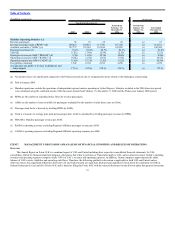
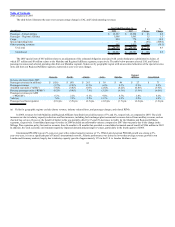
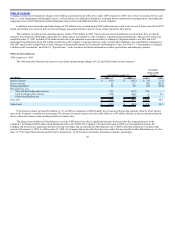
2008 compared to 2007
The table below illustrates the year-over-year percentage change in UAL and United operating revenues.
Year Ended December 31, $
Change
%
Change
(In millions) 2008 2007
Passenger—United Airlines $ 15,337 $ 15,254 $ 83 0.5
Passenger—Regional Affiliates 3,098 3,063 35 1.1
Cargo 854 770 84 10.9
Special operating items — 45 (45) (100.0)
Other operating revenues 905 1,011 (106) (10.5)
UAL total $ 20,194 $ 20,143 $ 51 0.3
United total $ 20,237 $ 20,131 $ 106 0.5
The 2007 special item of $45 million relates to an adjustment of the estimated obligation associated with certain bankruptcy administrative claims, of
which $37 million and $8 million relates to the Mainline and Regional Affiliates segments, respectively. The table below presents selected UAL and United
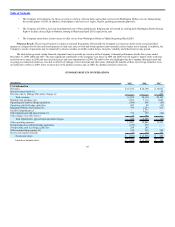
passenger revenues and selected operating data from our Mainline segment, broken out by geographic region with an associated allocation of the special revenue
item, and from our Regional Affiliates segment, expressed as year-over-year changes.
Domestic Pacific Atlantic Latin Mainline
Regional
Affiliates Consolidated
Increase (decrease) from 2007:
Passenger revenues (in millions) $ (156) $ (91) $ 263 $ 30 $ 46 $ 27 $ 73
Passenger revenues (1.7)% (2.8)% 11.1% 6.0% 0.3% 0.9% 0.4%
Available seat miles (“ASMs”) (7.8)% (4.8)% 11.0% (2.8)% (4.2)% (0.8)% (3.9)%
Revenue passenger miles (“RPMs”) (8.5)% (9.4)% 7.9% (5.5)% (6.3)% (3.9)% (6.0)%
Passenger revenues per ASM
(“PRASM”) 6.7% 2.1% 0.1% 9.0% 4.7% 1.8% 4.5%
Yield (a) 7.4% 7.2% 2.2% 12.7% 6.9% 5.0% 6.8%
Passenger load factor (points) (0.6) pts. (3.9) pts. (2.3) pts. (2.2) pts. (1.7) pts. (2.4) pts. (1.8) pts.
(a) Yields for geographic regions exclude charter revenue, industry reduced fares, and passenger charges, and related RPMs.
In 2008, revenues for both Mainline and Regional Affiliates benefited from yield increases of 7% and 5%, respectively, as compared to 2007. The yield
increases are due to industry capacity reductions and fare increases, including fuel surcharges plus incremental revenues derived from ancillary revenue, such as
checked bag services. However, the benefit of higher yields was partially offset by 6% and 4% decreases in traffic for the Mainline and Regional Affiliates
segments, respectively. Consolidated passenger revenues in 2008 included an unfavorable variance compared to 2007 that was partly due to the change in the
Mileage Plus expiration policy for inactive accounts from 36 months to 18 months that provided a consolidated estimated annual benefit of $246 million in 2007.
In addition, the weak economic environment negatively impacted demand and passenger revenues, particularly in the fourth quarter of 2008.
International PRASM was up 2% year-over-year with a related capacity increase of 1%. While Latin American PRASM growth was strong at 9%
year-over-year, it is not a significant part of United’s international network. Atlantic performance was driven by lower than average revenue growth in our
London and Germany markets, largely due to industry capacity growth of approximately 13% in the U.S. to London Heathrow route
44