United Airlines 2009 Annual Report Download - page 39
Download and view the complete annual report
Please find page 39 of the 2009 United Airlines annual report below. You can navigate through the pages in the report by either clicking on the pages listed below, or by using the keyword search tool below to find specific information within the annual report.-
 1
1 -
2
-
3
-
4
-
5
-
6
-
7
-
8
-
9
-
10
-
11
-
12
-
13
-
14
-
15
-
16
-
17
-
18
-
19
-
20
-
21
-
22
-
23
-
24
-
25
-
26
-
27
-
28
-
 29
29 -
 30
30 -
 31
31 -
 32
32 -
 33
33 -
 34
34 -
 35
35 -
 36
36 -
 37
37 -
 38
38 -
 39
39 -
 40
40 -
 41
41 -
 42
42 -
 43
43 -
 44
44 -
 45
45 -
 46
46 -
 47
47 -
 48
48 -
 49
49 -
50
-
51
-
52
-
53
-
54
-
55
-
56
-
57
-
58
-
59
-
60
-
61
-
62
-
63
-
64
-
65
-
66
-
67
-
68
-
69
-
70
-
71
-
72
-
73
-
74
-
75
-
76
-
77
-
78
-
79
-
80
-
81
-
82
-
83
-
84
-
85
-
86
-
87
-
88
-
89
-
90
-
91
-
92
-
93
-
94
-
95
-
96
-
97
-
98
-
99
-
100
-
101
-
102
-
103
-
104
-
105
-
106
-
107
-
108
-
109
-
110
-
111
-
112
-
113
-
114
-
115
-
116
-
117
-
118
-
119
-
120
-
121
-
122
-
123
-
124
-
125
-
126
-
127
-
128
-
129
-
130
-
131
-
132
-
133
-
134
-
135
-
136
-
137
-
138
-
139
-
140
-
141
-
142
-
143
-
144
-
145
-
146
-
147
-
148
-
149
-
150
-
151
-
152
-
153
-
154
-
155
-
156
-
157
-
158
-
159
-
160
-
161
-
162
-
163
-
164
-
165
-
166
-
167
-
168
-
169
-
170
-
171
-
172
-
173
-
174
-
175
-
176
 |
 |

Table of Contents
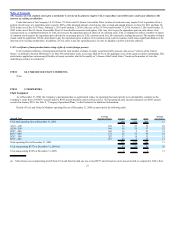
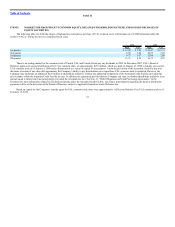
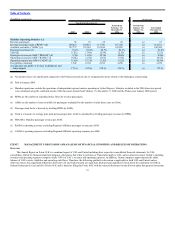
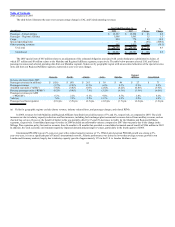
(In millions, except rates) Successor Predecessor
Year Ended December 31,
2009 2008 2007
Period from
February 1 to
December 31,
2006
Period from
January 1 to
January 31,
2006
Year Ended
December 31,
2005
Mainline Operating Statistics (c):
Revenue passengers 56 63 68 69 (c) 67
Revenue passenger miles (“RPMs”) (d) 100,475 110,061 117,399 117,470 (c) 114,272
Available seat miles (“ASMs”) (e) 122,737 135,861 141,890 143,095 (c) 140,300
Passenger load factor (f) 81.9% 81.0% 82.7% 82.1% (c) 81.4%
Yield (g) 11.81¢ 13.89¢ 12.99¢ 12.19¢ (c) 11.25¢
Passenger revenue per ASM (“PRASM”) (h) 9.70¢ 11.29¢ 10.78¢ 10.04¢ (c) 9.20¢
Operating revenue per ASM (“RASM”) (i) 10.81¢ 12.58¢ 12.03¢ 11.49¢ (c) 10.66¢
Operating expense per ASM (“CASM”) (j) 11.05¢ 15.74¢ 11.39¢ 11.23¢ (c) 10.59¢
Fuel gallons consumed 1,942 2,182 2,292 2,290 (c) 2,250
Average price per gallon of jet fuel, including tax and
hedge impact 175.3¢ 353.9¢ 218.3¢ 210.7¢ (c) 179.2¢
(a) Net income (loss) was significantly impacted in the Predecessor periods due to reorganization items related to the bankruptcy restructuring.
(b) Paid in January 2008.
(c) Mainline operations exclude the operations of independent regional carriers operating as United Express. Statistics included in the 2006 Successor period
were calculated using the combined results of the Successor period from February 1 to December 31, 2006 and the Predecessor January 2006 period.
(d) RPMs are the number of scheduled miles flown by revenue passengers.
(e) ASMs are the number of seats available for passengers multiplied by the number of miles those seats are flown.
(f) Passenger load factor is derived by dividing RPMs by ASMs.
(g) Yield is a measure of average price paid per passenger mile, which is calculated by dividing passenger revenues by RPMs.
(h) PRASM is Mainline passenger revenue per ASM.
(i) RASM is operating revenues excluding Regional Affiliates passenger revenue per ASM.
(j) CASM is operating expenses excluding Regional Affiliates operating expenses per ASM.
ITEM 7. MANAGEMENT’S DISCUSSION AND ANALYSIS OF FINANCIAL CONDITION AND RESULTS OF OPERATIONS.
Overview
This Annual Report on Form 10-K is a combined report of UAL and United including their respective consolidated financial statements. As UAL
consolidates United for financial statement purposes, disclosures that relate to activities of United also apply to UAL, unless otherwise noted. United’s operating
revenues and operating expenses comprise nearly 100% of UAL’s revenues and operating expenses. In addition, United comprises approximately the entire
balance of UAL’s assets, liabilities and operating cash flows. Therefore, the following qualitative discussion is applicable to both UAL and United, unless
otherwise noted. Any significant differences between UAL and United results are separately disclosed and explained. United meets the conditions set forth in
General Instruction I(1)(a) and (b) of Form 10-K and is therefore filing this Form 10-K with the reduced disclosure format allowed under that general instruction.
35