United Airlines 2009 Annual Report Download - page 81
Download and view the complete annual report
Please find page 81 of the 2009 United Airlines annual report below. You can navigate through the pages in the report by either clicking on the pages listed below, or by using the keyword search tool below to find specific information within the annual report.-
 1
1 -
2
-
3
-
4
-
5
-
6
-
7
-
8
-
9
-
10
-
11
-
12
-
13
-
14
-
15
-
16
-
17
-
18
-
19
-
20
-
21
-
22
-
23
-
24
-
25
-
26
-
27
-
28
-
29
-
30
-
31
-
32
-
33
-
34
-
35
-
36
-
37
-
38
-
39
-
40
-
41
-
42
-
43
-
44
-
45
-
46
-
47
-
48
-
49
-
50
-
51
-
52
-
53
-
54
-
55
-
56
-
57
-
58
-
59
-
60
-
61
-
62
-
63
-
64
-
65
-
66
-
67
-
68
-
69
-
70
-
 71
71 -
 72
72 -
 73
73 -
 74
74 -
 75
75 -
 76
76 -
 77
77 -
 78
78 -
 79
79 -
 80
80 -
 81
81 -
 82
82 -
 83
83 -
 84
84 -
 85
85 -
 86
86 -
 87
87 -
 88
88 -
 89
89 -
 90
90 -
 91
91 -
92
-
93
-
94
-
95
-
96
-
97
-
98
-
99
-
100
-
101
-
102
-
103
-
104
-
105
-
106
-
107
-
108
-
109
-
110
-
111
-
112
-
113
-
114
-
115
-
116
-
117
-
118
-
119
-
120
-
121
-
122
-
123
-
124
-
125
-
126
-
127
-
128
-
129
-
130
-
131
-
132
-
133
-
134
-
135
-
136
-
137
-
138
-
139
-
140
-
141
-
142
-
143
-
144
-
145
-
146
-
147
-
148
-
149
-
150
-
151
-
152
-
153
-
154
-
155
-
156
-
157
-
158
-
159
-
160
-
161
-
162
-
163
-
164
-
165
-
166
-
167
-
168
-
169
-
170
-
171
-
172
-
173
-
174
-
175
-
176
 |
 |

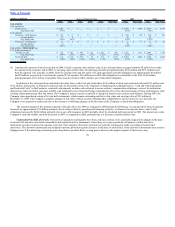
Table of Contents
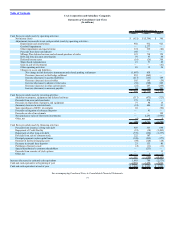
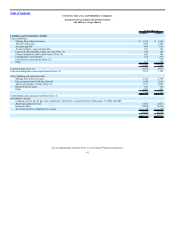
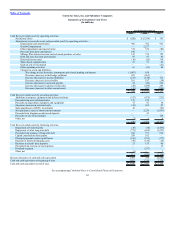
UAL Corporation and Subsidiary Companies
Statements of Consolidated Cash Flows
(In millions)
Year Ended December 31,
2009 2008 2007
Cash flows provided (used) by operating activities:
Net income (loss) $ (651) $ (5,396) $ 360
Adjustments to reconcile to net cash provided (used) by operating activities -
Depreciation and amortization 902 932 925
Goodwill impairment — 2,277 —
Other impairments and special items 374 339 (89)
Proceeds from lease amendment 160 — —
Mileage Plus deferred revenue and advanced purchase of miles 123 738 170
Debt and lease discount amortization 97 97 84
Deferred income taxes (16) (26) 310
Share-based compensation 21 31 49
Gain on sale of investments — — (41)
Other operating activities 89 15 56
Changes in assets and liabilities -
Net change in fuel derivative instruments and related pending settlements (1,007) 858 —
Decrease (increase) in fuel hedge collateral 955 (965) —
Increase (decrease) in accrued liabilities (217) (155) 189
Decrease (increase) in receivables 105 195 (59)
Increase (decrease) in advance ticket sales (38) (388) 249
Decrease (increase) in other current assets (25) 257 (269)
Increase (decrease) in accounts payable 94 (48) 200
966 (1,239) 2,134
Cash flows provided (used) by investing activities:
Additions to property, equipment and deferred software (317) (475) (723)
Proceeds from asset sale-leasebacks 175 274 —
Proceeds on disposition of property and equipment 77 94 19
(Increase) decrease in restricted cash (19) 484 91
Sales (purchases) of EETC investments 10 — (96)
Proceeds on litigation of advanced deposits — 41 —
Proceeds on sale of investments — — 128
Net (purchases) sales of short-term investments — 2,295 (1,983)
Other, net (6) 8 4
(80) 2,721 (2,560)
Cash flows provided (used) by financing activities:
Proceeds from issuance of long-term debt 907 337 694
Repayment of Credit Facility (18) (18) (1,495)
Repayment of other long-term debt (776) (666) (1,257)
Proceeds from sale of common stock 222 107 —
Principal payments under capital leases (190) (235) (177)
Payment of deferred financing costs (49) (120) (18)
Decrease in aircraft lease deposits 23 155 80
Purchases of treasury stock (2) (11) (11)
Special distribution to common shareholders — (253) —
Proceeds from exercise of stock options — — 35
Other, net — 2 2
117 (702) (2,147)
Increase (decrease) in cash and cash equivalents 1,003 780 (2,573)
Cash and cash equivalents at beginning of year 2,039 1,259 3,832
Cash and cash equivalents at end of year $ 3,042 $ 2,039 $ 1,259
See accompanying Combined Notes to Consolidated Financial Statements.
77