United Airlines 2009 Annual Report Download - page 55
Download and view the complete annual report
Please find page 55 of the 2009 United Airlines annual report below. You can navigate through the pages in the report by either clicking on the pages listed below, or by using the keyword search tool below to find specific information within the annual report.-
 1
1 -
2
-
3
-
4
-
5
-
6
-
7
-
8
-
9
-
10
-
11
-
12
-
13
-
14
-
15
-
16
-
17
-
18
-
19
-
20
-
21
-
22
-
23
-
24
-
25
-
26
-
27
-
28
-
29
-
30
-
31
-
32
-
33
-
34
-
35
-
36
-
37
-
38
-
39
-
40
-
41
-
42
-
43
-
44
-
 45
45 -
 46
46 -
 47
47 -
 48
48 -
 49
49 -
 50
50 -
 51
51 -
 52
52 -
 53
53 -
 54
54 -
 55
55 -
 56
56 -
 57
57 -
 58
58 -
 59
59 -
 60
60 -
 61
61 -
 62
62 -
 63
63 -
 64
64 -
 65
65 -
66
-
67
-
68
-
69
-
70
-
71
-
72
-
73
-
74
-
75
-
76
-
77
-
78
-
79
-
80
-
81
-
82
-
83
-
84
-
85
-
86
-
87
-
88
-
89
-
90
-
91
-
92
-
93
-
94
-
95
-
96
-
97
-
98
-
99
-
100
-
101
-
102
-
103
-
104
-
105
-
106
-
107
-
108
-
109
-
110
-
111
-
112
-
113
-
114
-
115
-
116
-
117
-
118
-
119
-
120
-
121
-
122
-
123
-
124
-
125
-
126
-
127
-
128
-
129
-
130
-
131
-
132
-
133
-
134
-
135
-
136
-
137
-
138
-
139
-
140
-
141
-
142
-
143
-
144
-
145
-
146
-
147
-
148
-
149
-
150
-
151
-
152
-
153
-
154
-
155
-
156
-
157
-
158
-
159
-
160
-
161
-
162
-
163
-
164
-
165
-
166
-
167
-
168
-
169
-
170
-
171
-
172
-
173
-
174
-
175
-
176
 |
 |
Table of Contents
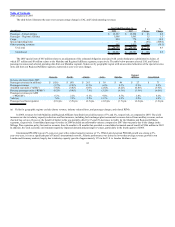
2008 compared to 2007
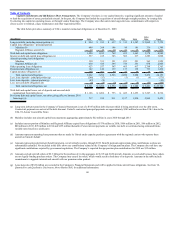
The following table illustrates the year-over-year dollar and percentage changes in UAL and United other income (expense).
Year Ended December 31,
Favorable/
(Unfavorable)
Change
(In millions) 2008 2007 $ %
Interest expense $ (571) $ (704) $ 133 18.9
Interest income 112 257 (145) (56.4)
Interest capitalized 20 19 1 5.3
Gain on sale of investment — 41 (41) (100.0)
Miscellaneous, net:
Non-cash fuel hedge gains (losses) (279) — (279) —
Cash fuel hedge gains (losses) (249) — (249) —
Other miscellaneous, net (22) 2 (24) —
UAL total $ (989) $ (385) $ (604) (156.9)
United total $ (989) $ (382) $ (607) (158.9)
UAL interest expense decreased $133 million, or 19%, in 2008 as compared to 2007. The 2008 period was favorably impacted by $1.5 billion of total
credit facility prepayments and the February 2007 credit facility amendment, which lowered United’s interest rate on these obligations. Scheduled debt obligation
repayments throughout 2008 and 2007 also reduced interest expense in 2008 as compared to 2007. Lower benchmark interest rates on the Company’s
variable-rate borrowings also reduced the Company’s interest expense in 2008 as compared to 2007. Interest expense in 2007 included the write-off of $17
million of previously capitalized debt issuance costs associated with the February 2007 Amended Credit Facility partial prepayment, $6 million of financing
costs associated with the February 2007 amendment and a gain of $22 million from a debt extinguishment. The benefit of lower interest expense in 2008 was
offset by a $145 million decrease in interest income due to lower average cash and short-term investment balances and lower investment yields. Interest expense
for the years ended December 31, 2008 and 2007 includes $48 million and $43 million, respectively, of non-cash interest expense related to the Company’s
retrospective adoption of new accounting principles related to convertible debt instruments that may be settled in cash upon conversion. See Liquidity and
Capital Resources below, for further details related to financing activities.
Nonoperating fuel hedge gains/losses relate to hedging instruments that are not classified as economic hedges. These net hedge gains/losses are presented
separately in the table above for purposes of additional analysis. These hedging gains/losses are due to favorable/unfavorable movements in crude oil prices
relative to the fuel hedge instrument terms. See Item 7A, Quantitative and Qualitative Disclosures about Market Risk and Note 12, “Fair Value Measurements
and Derivative Instruments,” in the Footnotes for further discussion of these hedges.
There were no significant investment gains or losses in 2008 as compared to 2007 during which the Company recorded a $41 million gain on sale of an
investment. This gain resulted from the Company’s sale of its 21.1% interest in Aeronautical Radio, Inc. during 2007.
The $24 million variance in Miscellaneous, net is primarily due to unfavorable foreign exchange rate fluctuations in 2008.
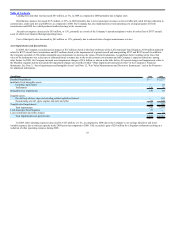
Income Taxes.
In 2009, UAL and United recorded a tax benefit of $17 million and $16 million, respectively, primarily due to the impairment of indefinite-lived intangible
assets, partially offset by income tax effects of items recorded in
51