United Airlines 2009 Annual Report Download - page 57
Download and view the complete annual report
Please find page 57 of the 2009 United Airlines annual report below. You can navigate through the pages in the report by either clicking on the pages listed below, or by using the keyword search tool below to find specific information within the annual report.-
 1
1 -
2
-
3
-
4
-
5
-
6
-
7
-
8
-
9
-
10
-
11
-
12
-
13
-
14
-
15
-
16
-
17
-
18
-
19
-
20
-
21
-
22
-
23
-
24
-
25
-
26
-
27
-
28
-
29
-
30
-
31
-
32
-
33
-
34
-
35
-
36
-
37
-
38
-
39
-
40
-
41
-
42
-
43
-
44
-
45
-
46
-
 47
47 -
 48
48 -
 49
49 -
 50
50 -
 51
51 -
 52
52 -
 53
53 -
 54
54 -
 55
55 -
 56
56 -
 57
57 -
 58
58 -
 59
59 -
 60
60 -
 61
61 -
 62
62 -
 63
63 -
 64
64 -
 65
65 -
 66
66 -
 67
67 -
68
-
69
-
70
-
71
-
72
-
73
-
74
-
75
-
76
-
77
-
78
-
79
-
80
-
81
-
82
-
83
-
84
-
85
-
86
-
87
-
88
-
89
-
90
-
91
-
92
-
93
-
94
-
95
-
96
-
97
-
98
-
99
-
100
-
101
-
102
-
103
-
104
-
105
-
106
-
107
-
108
-
109
-
110
-
111
-
112
-
113
-
114
-
115
-
116
-
117
-
118
-
119
-
120
-
121
-
122
-
123
-
124
-
125
-
126
-
127
-
128
-
129
-
130
-
131
-
132
-
133
-
134
-
135
-
136
-
137
-
138
-
139
-
140
-
141
-
142
-
143
-
144
-
145
-
146
-
147
-
148
-
149
-
150
-
151
-
152
-
153
-
154
-
155
-
156
-
157
-
158
-
159
-
160
-
161
-
162
-
163
-
164
-
165
-
166
-
167
-
168
-
169
-
170
-
171
-
172
-
173
-
174
-
175
-
176
 |
 |
Table of Contents
Although the factors described above may adversely impact the Company’s liquidity, the Company believes it has an adequate available cash position,
together with other sources of cash, to fund current operations. UAL’s unrestricted and restricted cash balances were $3.0 billion and $341 million, respectively,
at December 31, 2009. In addition, the Company has recently taken actions to improve its liquidity and reduce near-term obligations and believes it may access
additional capital in the future, as described below.
• During 2009, the Company’s liquidity initiatives generated unrestricted cash of more than $1.5 billion primarily from the issuance of UAL common
stock, proceeds from debt obligations and aircraft asset sale-leasebacks. Additional proceeds of approximately $900 million from financings have
either been, or will be, received in 2010 as discussed below. Certain of these initiatives were used to refinance existing debt obligations,
significantly reducing the Company’s 2010 and 2011 debt obligations;
• The Company has a limited amount of unencumbered aircraft and other assets may be sold or otherwise used as collateral to obtain additional
financing. In addition, in 2010 and 2011, additional aircraft will become unencumbered as various debt and lease obligations mature. These aircraft
may be used to obtain new financings; and
• During 2009 and 2008, the Company took aggressive actions to right-size its business including significant capacity reductions, disposition of
underperforming assets and a workforce reduction, among others.
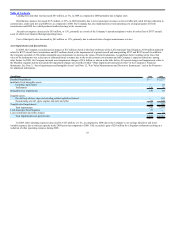
Cash Position and Liquidity. As of December 31, 2009, approximately 25% of the Company’s cash and cash equivalents were invested in money market
funds that primarily invest in U.S. treasury securities and the remainder was invested in AAA-rated money market funds. There are no withdrawal restrictions at
the present time on any of the money market funds in which the Company has invested. We believe credit risk is limited with respect to our money market fund
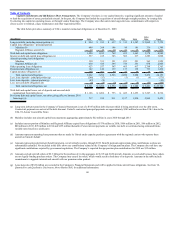
investments. The following table provides a summary of UAL’s net cash provided (used) by operating, investing and financing activities for the years ended
December 31, 2009, 2008 and 2007 and total cash position as of December 31, 2009 and 2008.
Year Ended December 31,
(In millions) 2009 2008 2007
Net cash provided (used) by operating activities $ 966 $ (1,239) $ 2,134
Net cash provided (used) by investing activities (80) 2,721 (2,560)
Net cash provided (used) by financing activities 117 (702) (2,147)
As of December 31,
2009 2008
Cash and cash equivalents $ 3,042 $ 2,039
Restricted cash 341 272
Total cash and cash equivalents and restricted cash $ 3,383 $ 2,311
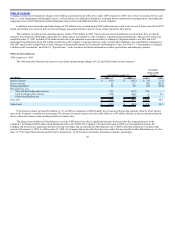
The Company’s cash position represents an important source of liquidity. The change in cash from 2007 to 2009 is explained below. Restricted cash
primarily represents cash collateral to secure workers’ compensation obligations, cash collateral received from fuel derivative counterparties to secure their
obligations, security deposits for airport leases and reserves with institutions that process our credit card ticket sales. We may be required to post significant
additional cash collateral to meet such obligations in the future. The Company has a $255 million revolving commitment under its Amended Credit Facility, of
which $254 million had been used for letters of credit as of both December 31, 2009 and 2008. In addition, under a separate agreement, the Company had $20
million of letters of credit issued as of December 31, 2009.
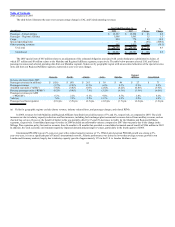
Cash Flows from Operating Activities.
2009 compared to 2008
UAL’s cash from operations increased by $2.2 billion in 2009 as compared to the prior year. This improvement was partly due to decreased cash required
for aircraft fuel purchases as consolidated fuel purchase
53