United Airlines 2009 Annual Report Download - page 113
Download and view the complete annual report
Please find page 113 of the 2009 United Airlines annual report below. You can navigate through the pages in the report by either clicking on the pages listed below, or by using the keyword search tool below to find specific information within the annual report.-
 1
1 -
2
-
3
-
4
-
5
-
6
-
7
-
8
-
9
-
10
-
11
-
12
-
13
-
14
-
15
-
16
-
17
-
18
-
19
-
20
-
21
-
22
-
23
-
24
-
25
-
26
-
27
-
28
-
29
-
30
-
31
-
32
-
33
-
34
-
35
-
36
-
37
-
38
-
39
-
40
-
41
-
42
-
43
-
44
-
45
-
46
-
47
-
48
-
49
-
50
-
51
-
52
-
53
-
54
-
55
-
56
-
57
-
58
-
59
-
60
-
61
-
62
-
63
-
64
-
65
-
66
-
67
-
68
-
69
-
70
-
71
-
72
-
73
-
74
-
75
-
76
-
77
-
78
-
79
-
80
-
81
-
82
-
83
-
84
-
85
-
86
-
87
-
88
-
89
-
90
-
91
-
92
-
93
-
94
-
95
-
96
-
97
-
98
-
99
-
100
-
101
-
102
-
 103
103 -
 104
104 -
 105
105 -
 106
106 -
 107
107 -
 108
108 -
 109
109 -
 110
110 -
 111
111 -
 112
112 -
 113
113 -
 114
114 -
 115
115 -
 116
116 -
 117
117 -
 118
118 -
 119
119 -
 120
120 -
 121
121 -
 122
122 -
 123
123 -
124
-
125
-
126
-
127
-
128
-
129
-
130
-
131
-
132
-
133
-
134
-
135
-
136
-
137
-
138
-
139
-
140
-
141
-
142
-
143
-
144
-
145
-
146
-
147
-
148
-
149
-
150
-
151
-
152
-
153
-
154
-
155
-
156
-
157
-
158
-
159
-
160
-
161
-
162
-
163
-
164
-
165
-
166
-
167
-
168
-
169
-
170
-
171
-
172
-
173
-
174
-
175
-
176
 |
 |
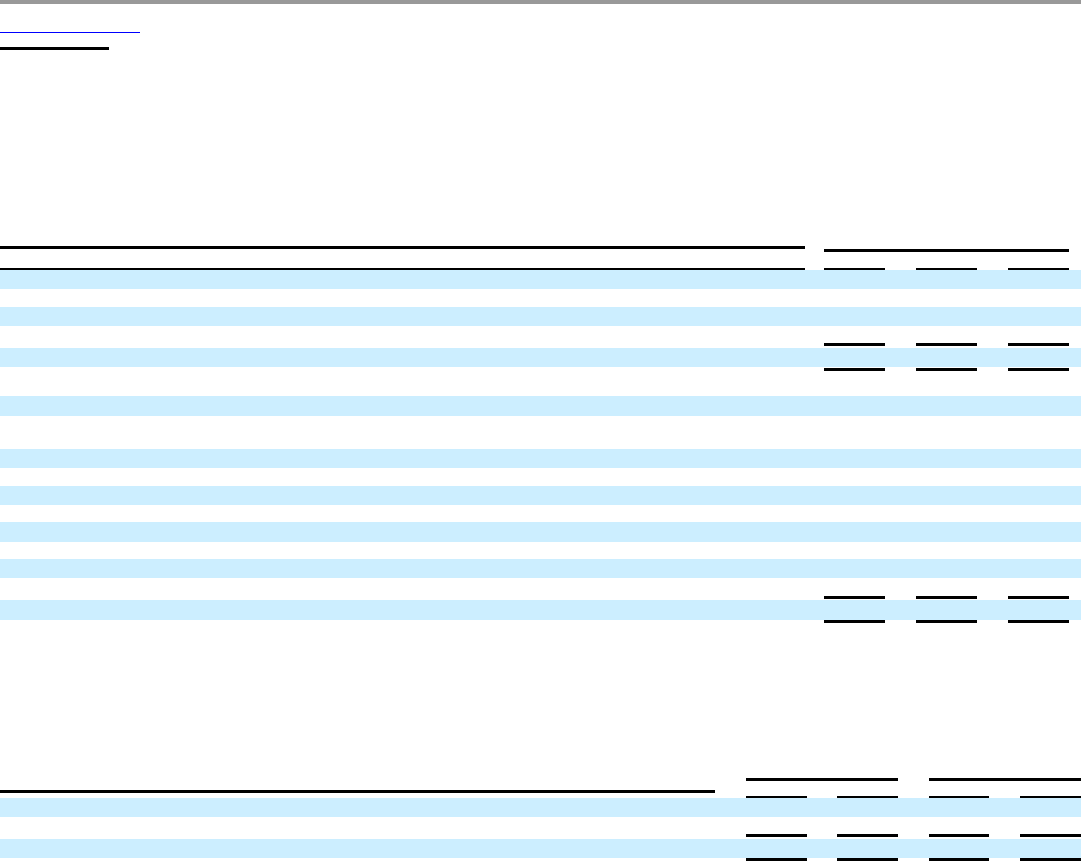
Table of Contents
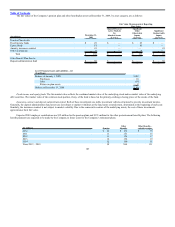
(a) Regional Affiliates depreciation expense relates to aircraft used in Regional Affiliates operations. This depreciation is included in Regional Affiliates
expense in the Company’s Financial Statements.
(b) Equity earnings are part of the Mainline segment.
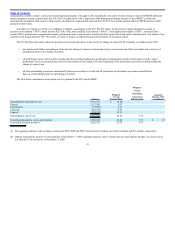
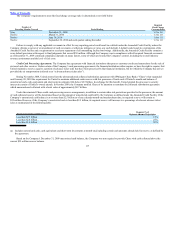
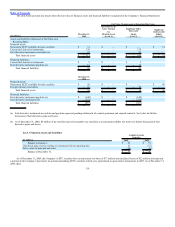
The following table presents United segment information for the years ended December 31, 2009, 2008 and 2007:
(In millions) Year Ended December 31,
United 2009 2008 2007
Revenue:
Mainline $ 13,295 $ 17,139 $ 17,023
Regional Affiliates 3,064 3,098 3,063
Special revenue items — — 45
Total $ 16,359 $ 20,237 $ 20,131
Depreciation and amortization:
Mainline $ 902 $ 932 $ 925
Regional Affiliates 8 6 9
Segment earnings (loss) and reconciliation to Financial Statements:
Mainline $ (395) $ (2,610) $ 403
Regional Affiliates 125 (150) 122
Special revenue items (Note 18) — — 45
Goodwill impairment — (2,277) —
Other impairments and special items (Note 18) (374) (339) 44
Gain on sale of investment (Note 19) — — 41
Less: Equity earnings in affiliates (4) (6) (5)
Consolidated earnings (loss) before income taxes and equity earnings in affiliates) $ (648) $ (5,382) $ 650
The Company does not allocate interest income or interest expense to the Regional Affiliates segment in reports used to evaluate segment performance.
Therefore, all amounts classified as interest income and interest expense in the Financial Statements relate to the Mainline segment.
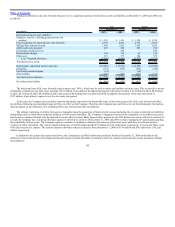
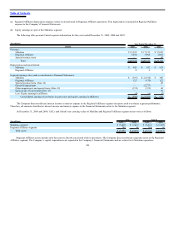
At December 31, 2009 and 2008, UAL’s and United’s net carrying values of Mainline and Regional Affiliates segment assets were as follows:
(In millions) UAL United
2009 2008 2009 2008
Mainline segment $ 18,400 $ 19,419 $ 18,441 $ 19,589
Regional Affiliates segment 284 46 284 46
Total assets $ 18,684 $ 19,465 $ 18,725 $ 19,635
Regional Affiliates assets include only those assets directly associated with its operations. The Company does not allocate corporate assets to the Regional
Affiliates segment. The Company’s capital expenditures are reported in the Company’s Financial Statements and are related to its Mainline operations.
109