United Airlines 2009 Annual Report Download - page 74
Download and view the complete annual report
Please find page 74 of the 2009 United Airlines annual report below. You can navigate through the pages in the report by either clicking on the pages listed below, or by using the keyword search tool below to find specific information within the annual report.-
 1
1 -
2
-
3
-
4
-
5
-
6
-
7
-
8
-
9
-
10
-
11
-
12
-
13
-
14
-
15
-
16
-
17
-
18
-
19
-
20
-
21
-
22
-
23
-
24
-
25
-
26
-
27
-
28
-
29
-
30
-
31
-
32
-
33
-
34
-
35
-
36
-
37
-
38
-
39
-
40
-
41
-
42
-
43
-
44
-
45
-
46
-
47
-
48
-
49
-
50
-
51
-
52
-
53
-
54
-
55
-
56
-
57
-
58
-
59
-
60
-
61
-
62
-
63
-
 64
64 -
 65
65 -
 66
66 -
 67
67 -
 68
68 -
 69
69 -
 70
70 -
 71
71 -
 72
72 -
 73
73 -
 74
74 -
 75
75 -
 76
76 -
 77
77 -
 78
78 -
 79
79 -
 80
80 -
 81
81 -
 82
82 -
 83
83 -
 84
84 -
85
-
86
-
87
-
88
-
89
-
90
-
91
-
92
-
93
-
94
-
95
-
96
-
97
-
98
-
99
-
100
-
101
-
102
-
103
-
104
-
105
-
106
-
107
-
108
-
109
-
110
-
111
-
112
-
113
-
114
-
115
-
116
-
117
-
118
-
119
-
120
-
121
-
122
-
123
-
124
-
125
-
126
-
127
-
128
-
129
-
130
-
131
-
132
-
133
-
134
-
135
-
136
-
137
-
138
-
139
-
140
-
141
-
142
-
143
-
144
-
145
-
146
-
147
-
148
-
149
-
150
-
151
-
152
-
153
-
154
-
155
-
156
-
157
-
158
-
159
-
160
-
161
-
162
-
163
-
164
-
165
-
166
-
167
-
168
-
169
-
170
-
171
-
172
-
173
-
174
-
175
-
176
 |
 |
Table of Contents
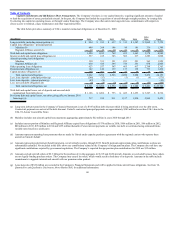
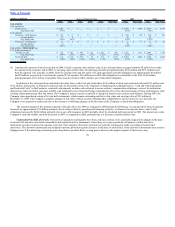
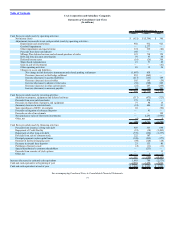
(Dollars in millions) Expected Maturity Date 2009 2008
2010 2011 2012 2013 2014 Thereafter Total Fair Value Total Fair Value
UAL ASSETS
Cash equivalents
Fixed rate (a) $ 3,042 $ — $ — $ — $ — $ — $ 3,042 $ 3,042 $ 2,039 $ 2,039
Avg. interest rate 0.07% — — — — — 0.07% 1.02%
Lease deposits
Fixed rate—EUR deposits $ 235 $ 15 $ — $ — $ — $ — $ 250 $ 309 $ 264 $ 330
Accrued interest 37 8 — — — — 45 42
Avg. interest rate 6.86% 4.41% — — — — 6.45% 6.45%
Fixed rate—USD deposits $ 11 $ 2 $ — $ 1 $ 1 $ 6 $ 21 $ 31 $ 11 $ 21
Accrued interest 10 — — — — — 10 9
Avg. interest rate 6.49% — — — — — 6.49% 6.49%
UAL LONG—TERM DEBT (a)
U. S. Dollar denominated
Variable rate debt $ 282 $ 205 $ 204 $ 222 $ 1,386 $ 286 $ 2,585 $ 2,236 $ 2,640 $ 1,524
Avg. interest rate 2.04% 2.42% 2.42% 2.33% 2.72% 2.19% 2.51% 3.24%
Fixed rate debt $ 712 $ 710 $ 433 $ 93 $ 161 $ 2,576 $ 4,685 $ 4,062 $ 4,388 $ 2,668
Avg. interest rate 7.04% 7.09% 9.65% 8.97% 7.37% 5.93% 6.73% 6.09%
(a) Amounts also represent United except that in 2009, United’s carrying value and fair value of its cash equivalents are approximately $6 million lower than
the reported UAL amounts, and in 2009, its carrying value and fair value of total long-term debt are approximately $346 million and $553 million lower
than the reported UAL amounts. In 2008, United’s carrying value and fair value of its cash equivalents and debt obligations are approximately $6 million
and $2 million, respectively, lower than the reported UAL amounts. The difference in 2009 debt obligations is attributable to the UAL $345 million
principal amount of 6% Senior Convertible Notes issued in October 2009, which is not a United debt obligation.
In addition to the cash equivalents included in the table above, both UAL and United have $128 million of short-term restricted cash and $213 million and
$212 million, respectively, of long-term restricted cash. As discussed in Note 1(d), “Summary of Significant Accounting Policies—Cash and Cash Equivalents
and Restricted Cash,” in the Footnotes, restricted cash primarily includes cash collateral to secure workers’ compensation obligations, reserves for institutions
that process credit card ticket sales and, in 2009, cash collateral received from fuel hedge counterparties. Due to the short term nature of these cash balances, their
carrying values approximate their fair values. The Company’s interest income is exposed to changes in interest rates on these cash balances. During 2007, the
Company also repurchased certain of its own debt instruments, which remain outstanding and have a fair value and carrying value of $51 million at
December 31, 2009. The Company recognizes changes in fair value of these securities through other comprehensive income; however, on a net basis, the
Company is not exposed to market risk due to the existence of offsetting changes in the fair value of the Company’s related debt obligations.
The material changes in the amounts reported in the table above for 2009 as compared to 2008 include the following: (1) cash and short-term investments
increased by approximately $1.0 billion primarily due to cash provided by operating and financing activities, as discussed in Liquidity above; and (2) debt
obligations increased by $242 million primarily due to new debt issuances in 2009, partially offset by scheduled debt repayments in 2009. The interest rate on the
Company’s cash and variable rate debt decreased in 2009, as compared to 2008, primarily due to a decrease in market interest rates.
Commodity Price Risk (Jet Fuel). Our results of operations and liquidity have been, and may continue to be, materially impacted by changes in the price
of aircraft fuel and other oil-related commodities and related derivative instruments. United may use swaps, purchased call options or other derivative
instruments to reduce its price risk exposure to jet fuel. The Company’s derivative positions are typically comprised of crude oil, heating oil and jet fuel
derivatives. The derivative instruments are designed to provide protection against increases in the price of aircraft fuel. Some derivative instruments may result in
hedging losses if the underlying commodity prices drop below specified floors or swap prices; however, the negative impact of these losses may
70