United Airlines 2009 Annual Report Download - page 114
Download and view the complete annual report
Please find page 114 of the 2009 United Airlines annual report below. You can navigate through the pages in the report by either clicking on the pages listed below, or by using the keyword search tool below to find specific information within the annual report.-
 1
1 -
2
-
3
-
4
-
5
-
6
-
7
-
8
-
9
-
10
-
11
-
12
-
13
-
14
-
15
-
16
-
17
-
18
-
19
-
20
-
21
-
22
-
23
-
24
-
25
-
26
-
27
-
28
-
29
-
30
-
31
-
32
-
33
-
34
-
35
-
36
-
37
-
38
-
39
-
40
-
41
-
42
-
43
-
44
-
45
-
46
-
47
-
48
-
49
-
50
-
51
-
52
-
53
-
54
-
55
-
56
-
57
-
58
-
59
-
60
-
61
-
62
-
63
-
64
-
65
-
66
-
67
-
68
-
69
-
70
-
71
-
72
-
73
-
74
-
75
-
76
-
77
-
78
-
79
-
80
-
81
-
82
-
83
-
84
-
85
-
86
-
87
-
88
-
89
-
90
-
91
-
92
-
93
-
94
-
95
-
96
-
97
-
98
-
99
-
100
-
101
-
102
-
103
-
 104
104 -
 105
105 -
 106
106 -
 107
107 -
 108
108 -
 109
109 -
 110
110 -
 111
111 -
 112
112 -
 113
113 -
 114
114 -
 115
115 -
 116
116 -
 117
117 -
 118
118 -
 119
119 -
 120
120 -
 121
121 -
 122
122 -
 123
123 -
 124
124 -
125
-
126
-
127
-
128
-
129
-
130
-
131
-
132
-
133
-
134
-
135
-
136
-
137
-
138
-
139
-
140
-
141
-
142
-
143
-
144
-
145
-
146
-
147
-
148
-
149
-
150
-
151
-
152
-
153
-
154
-
155
-
156
-
157
-
158
-
159
-
160
-
161
-
162
-
163
-
164
-
165
-
166
-
167
-
168
-
169
-
170
-
171
-
172
-
173
-
174
-
175
-
176
 |
 |

Table of Contents
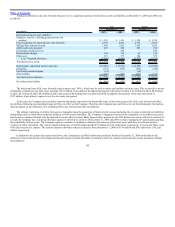
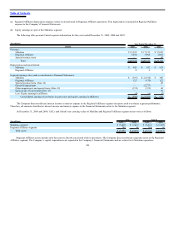
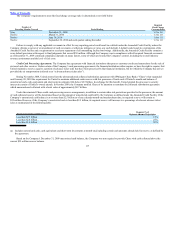
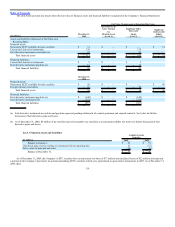
UAL and United’s operating revenue by principal geographic region (as defined by the U.S. Department of Transportation) for the years ended
December 31, 2009, 2008 and 2007 is presented in the table below.
(In millions) Year Ended December 31,
UAL 2009 2008 2007
Domestic (U.S. and Canada) $ 10,775 $ 12,819 $ 14,006
Pacific 2,628 3,712 3,262
Atlantic 2,538 3,055 2,365
Latin America 394 608 510
Total UAL $ 16,335 $ 20,194 $ 20,143
Add (Less): UAL other domestic 24 43 (12)
Total United $ 16,359 $ 20,237 $ 20,131
The Company attributes revenue among the geographic areas based upon the origin and destination of each flight segment. United’s operations involve an
insignificant level of dedicated revenue-producing assets in geographic regions as the overwhelming majority of the Company’s revenue producing assets
(primarily U.S. registered aircraft) generally can be deployed in any of its geographic regions, as any given aircraft may be used in multiple geographic regions
on any given day.
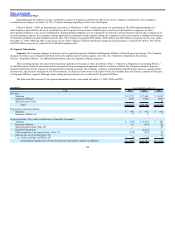
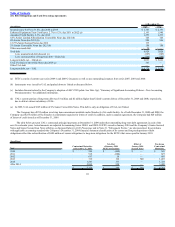
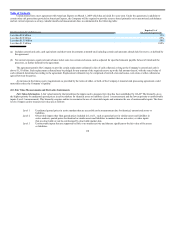
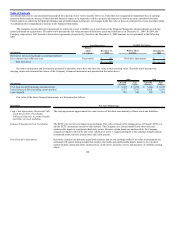
(10) Accumulated Other Comprehensive Income
The table below presents the components of the Company’s accumulated other comprehensive income, net of tax. See Note 8, “Retirement and
Postretirement Plans” and Note 12, “Fair Value Measurements and Financial Instruments,” for further information on these items.
(In millions) As of December 31,
2009 2008 2007
Pension and other postretirement gains, net of tax $ 57 $ 130 $ 141
Financial instrument losses, net of tax (22) (37) —
Accumulated other comprehensive income, net of tax $ 35 $ 93 $ 141
During the 2006 adoption of a new accounting policy related to the impact of the Medicare Part D subsidy on postretirement plans, the Company recorded
deferred taxes on the portion of other comprehensive income. In 2007, the Company recomputed deferred taxes on the portion of the initial other comprehensive
balance at the adoption date excluding the amount of comprehensive income attributable to the Medicare Part D subsidiary. This adjustment of $40 million is
excluded from 2007 comprehensive income and is reported separately in the Company’s Financial Statements.
110