United Airlines 2009 Annual Report Download - page 46
Download and view the complete annual report
Please find page 46 of the 2009 United Airlines annual report below. You can navigate through the pages in the report by either clicking on the pages listed below, or by using the keyword search tool below to find specific information within the annual report.-
 1
1 -
2
-
3
-
4
-
5
-
6
-
7
-
8
-
9
-
10
-
11
-
12
-
13
-
14
-
15
-
16
-
17
-
18
-
19
-
20
-
21
-
22
-
23
-
24
-
25
-
26
-
27
-
28
-
29
-
30
-
31
-
32
-
33
-
34
-
35
-
 36
36 -
 37
37 -
 38
38 -
 39
39 -
 40
40 -
 41
41 -
 42
42 -
 43
43 -
 44
44 -
 45
45 -
 46
46 -
 47
47 -
 48
48 -
 49
49 -
 50
50 -
 51
51 -
 52
52 -
 53
53 -
 54
54 -
 55
55 -
 56
56 -
57
-
58
-
59
-
60
-
61
-
62
-
63
-
64
-
65
-
66
-
67
-
68
-
69
-
70
-
71
-
72
-
73
-
74
-
75
-
76
-
77
-
78
-
79
-
80
-
81
-
82
-
83
-
84
-
85
-
86
-
87
-
88
-
89
-
90
-
91
-
92
-
93
-
94
-
95
-
96
-
97
-
98
-
99
-
100
-
101
-
102
-
103
-
104
-
105
-
106
-
107
-
108
-
109
-
110
-
111
-
112
-
113
-
114
-
115
-
116
-
117
-
118
-
119
-
120
-
121
-
122
-
123
-
124
-
125
-
126
-
127
-
128
-
129
-
130
-
131
-
132
-
133
-
134
-
135
-
136
-
137
-
138
-
139
-
140
-
141
-
142
-
143
-
144
-
145
-
146
-
147
-
148
-
149
-
150
-
151
-
152
-
153
-
154
-
155
-
156
-
157
-
158
-
159
-
160
-
161
-
162
-
163
-
164
-
165
-
166
-
167
-
168
-
169
-
170
-
171
-
172
-
173
-
174
-
175
-
176
 |
 |

Table of Contents
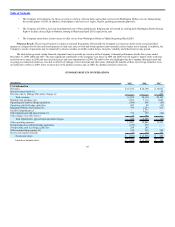
Results of Operations
Operating Revenues.
2009 compared to 2008
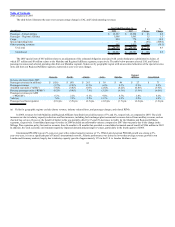
The table below illustrates the year-over-year percentage change in UAL and United operating revenues.
Year Ended December 31, $
Change
%
Change
(In millions) 2009 2008
Passenger—United Airlines $ 11,910 $ 15,337 (3,427) (22.3)
Passenger—Regional Affiliates 3,064 3,098 (34) (1.1)
Cargo 536 854 (318) (37.2)
Other operating revenues 825 905 (80) (8.8)
UAL total $ 16,335 $ 20,194 $ (3,859) (19.1)
United total $ 16,359 $ 20,237 $ (3,878) (19.2)
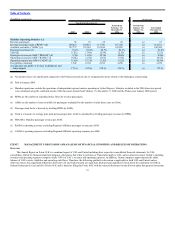
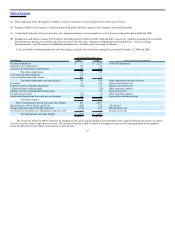
The table below presents UAL and United passenger revenues and selected operating data from our Mainline segment, broken out by geographic region,
and from our Regional Affiliates segment, expressed as year-over-year changes.
Domestic Pacific Atlantic Latin Mainline
Regional
Affiliates Consolidated
Increase (decrease) from 2008:
Passenger revenues (in millions) $ (1,908) $ (916) $ (407) $ (196) $ (3,427) $ (34) $ (3,461)
Passenger revenues (21.2)% (28.9)% (15.5)% (36.3)% (22.3)% (1.1)% (18.8)%
Available seat miles (“ASMs”) (10.4)% (11.5)% (2.6)% (18.5)% (9.7)% 11.2% (7.4)%
Revenue passenger miles
(“RPMs”) (9.2)% (10.6)% (2.5)% (19.2)% (8.7)% 13.3% (6.5)%
Passenger revenues per ASM
(“PRASM”) (12.0)% (19.7)% (13.2)% (21.8)% (14.1)% (11.1)% (12.3)%
Yield (a) (15.4)% (17.2)% (10.1)% (16.6)% (15.0)% (12.7)% (13.2)%
Passenger load factor (points) 1.1pts. 0.8 pts. 0.1 pts. (0.7)pts. 0.9pts. 1.4 pts. 0.8pts.
(a) Yields for geographic regions exclude charter revenue, industry reduced fares, and passenger charges, and related RPMs.
Consistent with the rest of the airline industry, the Company’s decline in PRASM was driven by a precipitous decline in worldwide travel demand as a
result of the severe global recession. Two factors had a distinct impact on United’s revenue during 2009.
First, network composition played a role in overall unit revenue decline. International markets, in particular the Pacific region, experienced more
significant unit revenue declines as compared to the other regions. Given United’s strong international network and its historic relative contribution to revenues,
the Company’s revenues were disproportionately impacted by the contraction in travel demand in the Pacific.
Second, while demand declined across all geographic regions, premium and business demand declined more significantly than leisure demand. As
United’s business model is strongly aligned to serve premium and business travelers, both internationally and domestically, the decrease in travel by business
travelers and the buy-down from premium class to economy class by some business travelers caused a significant negative impact on our results of operations.
However, in the fourth quarter of 2009, the Company began to see signs of improvement, as discussed below.
42