United Airlines 2009 Annual Report Download - page 75
Download and view the complete annual report
Please find page 75 of the 2009 United Airlines annual report below. You can navigate through the pages in the report by either clicking on the pages listed below, or by using the keyword search tool below to find specific information within the annual report.-
 1
1 -
2
-
3
-
4
-
5
-
6
-
7
-
8
-
9
-
10
-
11
-
12
-
13
-
14
-
15
-
16
-
17
-
18
-
19
-
20
-
21
-
22
-
23
-
24
-
25
-
26
-
27
-
28
-
29
-
30
-
31
-
32
-
33
-
34
-
35
-
36
-
37
-
38
-
39
-
40
-
41
-
42
-
43
-
44
-
45
-
46
-
47
-
48
-
49
-
50
-
51
-
52
-
53
-
54
-
55
-
56
-
57
-
58
-
59
-
60
-
61
-
62
-
63
-
64
-
 65
65 -
 66
66 -
 67
67 -
 68
68 -
 69
69 -
 70
70 -
 71
71 -
 72
72 -
 73
73 -
 74
74 -
 75
75 -
 76
76 -
 77
77 -
 78
78 -
 79
79 -
 80
80 -
 81
81 -
 82
82 -
 83
83 -
 84
84 -
 85
85 -
86
-
87
-
88
-
89
-
90
-
91
-
92
-
93
-
94
-
95
-
96
-
97
-
98
-
99
-
100
-
101
-
102
-
103
-
104
-
105
-
106
-
107
-
108
-
109
-
110
-
111
-
112
-
113
-
114
-
115
-
116
-
117
-
118
-
119
-
120
-
121
-
122
-
123
-
124
-
125
-
126
-
127
-
128
-
129
-
130
-
131
-
132
-
133
-
134
-
135
-
136
-
137
-
138
-
139
-
140
-
141
-
142
-
143
-
144
-
145
-
146
-
147
-
148
-
149
-
150
-
151
-
152
-
153
-
154
-
155
-
156
-
157
-
158
-
159
-
160
-
161
-
162
-
163
-
164
-
165
-
166
-
167
-
168
-
169
-
170
-
171
-
172
-
173
-
174
-
175
-
176
 |
 |
Table of Contents
be offset by the benefit of lower jet fuel acquisition cost since the Company typically does not hedge all of its fuel consumption, and only uses swaps or sold puts
on a portion of the fuel volumes that it does hedge. United may adjust its hedging program based on changes in market conditions. At December 31, 2009, the
fair value of United’s fuel-related derivatives was a payable of $5 million and a receivable of $138 million, as compared to a payable of $727 million at
December 31, 2008. The primary reasons for this change were the dramatic decrease in fuel prices in the latter part of 2008, subsequent fuel price increases in
2009 and turnover of the Company’s hedge portfolio to instruments with a lower average strike price. At December 31, 2009, the Company also had $15 million
of additional fuel derivative payables related to pending settlements for purchased call options and expired contracts.
As of December 31, 2009, the Company had hedged approximately 36% of its 2010 consolidated fuel consumption primarily with a combination of swaps
and purchased call options. The Company’s hedge position at December 31, 2009 consists of a notional amount of 9.7 million barrels with purchased call options
at a weighted-average crude oil equivalent strike price of $76 per barrel and 9.9 million barrels with swaps at an average price of $77 per barrel. All of these
derivative instruments mature within 12 months of December 31, 2009. As of December 31, 2008, the Company had hedged 34% of its 2009 consolidated fuel
consumption, primarily with collar structures. The Company had significant losses on its 2008 hedge position as certain of the collar structures required
payments by United to its counterparties for decreases in the price of crude oil below approximately $100 per barrel.
The above derivative positions are subject to potential counterparty cash collateral requirements in some circumstances. The Company provided
counterparties with cash collateral of $10 million as of December 31, 2009.
Foreign Currency. United generates revenues and incurs expenses in numerous foreign currencies. Such expenses include fuel, aircraft leases,
commissions, catering, personnel expense, advertising and distribution costs, customer service expenses and aircraft maintenance. Changes in foreign currency
exchange rates impact the Company’s results of operations through changes in the dollar value of foreign currency-denominated operating revenues and
expenses.
Despite the adverse effects a strengthening foreign currency may have on demand for U.S.-originating traffic, a strengthening of foreign currencies tends
to increase reported revenue and operating income because the Company’s foreign currency-denominated operating revenue generally exceeds its foreign
currency-denominated operating expense for each currency. Likewise, despite the favorable effects a weakening foreign currency may have on demand for
U.S.-originating traffic, a weakening of foreign currencies tends to decrease reported revenue and operating income.
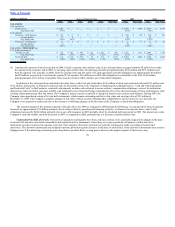
The Company’s most significant net foreign currency exposures in 2009, based on exchange rates in effect at December 31, 2009, are presented in the
table below:
(In millions) Operating revenue net of operating expense
Currency
Foreign
Currency Value USD Value
Canadian dollar 284 $ 269
Chinese renminbi 1,686 247
European euro 60 86
South Korean Won 70,725 61
Australian dollar 57 51
The Company may use foreign currency forward contracts to hedge a portion of its exposure to changes in foreign currency exchange rates. As of
December 31, 2009, the Company did not have any derivative positions to hedge foreign currency cash flows. As of December 31, 2008, the Company hedged a
portion of its expected foreign currency cash flows in the Australian dollar, Canadian dollar and European euro. As of December 31, 2008, the notional amount
of these foreign currencies hedged with the forward contracts in U.S. dollars terms was approximately $62 million, based on contractual forward rates. These
contracts had a fair value of $10 million at December 31, 2008.
71