United Airlines 2009 Annual Report Download - page 42
Download and view the complete annual report
Please find page 42 of the 2009 United Airlines annual report below. You can navigate through the pages in the report by either clicking on the pages listed below, or by using the keyword search tool below to find specific information within the annual report.-
 1
1 -
2
-
3
-
4
-
5
-
6
-
7
-
8
-
9
-
10
-
11
-
12
-
13
-
14
-
15
-
16
-
17
-
18
-
19
-
20
-
21
-
22
-
23
-
24
-
25
-
26
-
27
-
28
-
29
-
30
-
31
-
 32
32 -
 33
33 -
 34
34 -
 35
35 -
 36
36 -
 37
37 -
 38
38 -
 39
39 -
 40
40 -
 41
41 -
 42
42 -
 43
43 -
 44
44 -
 45
45 -
 46
46 -
 47
47 -
 48
48 -
 49
49 -
 50
50 -
 51
51 -
 52
52 -
53
-
54
-
55
-
56
-
57
-
58
-
59
-
60
-
61
-
62
-
63
-
64
-
65
-
66
-
67
-
68
-
69
-
70
-
71
-
72
-
73
-
74
-
75
-
76
-
77
-
78
-
79
-
80
-
81
-
82
-
83
-
84
-
85
-
86
-
87
-
88
-
89
-
90
-
91
-
92
-
93
-
94
-
95
-
96
-
97
-
98
-
99
-
100
-
101
-
102
-
103
-
104
-
105
-
106
-
107
-
108
-
109
-
110
-
111
-
112
-
113
-
114
-
115
-
116
-
117
-
118
-
119
-
120
-
121
-
122
-
123
-
124
-
125
-
126
-
127
-
128
-
129
-
130
-
131
-
132
-
133
-
134
-
135
-
136
-
137
-
138
-
139
-
140
-
141
-
142
-
143
-
144
-
145
-
146
-
147
-
148
-
149
-
150
-
151
-
152
-
153
-
154
-
155
-
156
-
157
-
158
-
159
-
160
-
161
-
162
-
163
-
164
-
165
-
166
-
167
-
168
-
169
-
170
-
171
-
172
-
173
-
174
-
175
-
176
 |
 |

Table of Contents
• The Company will commence its first-ever service to Africa, with one daily, same-plane service from Washington Dulles to Accra, Ghana during
the second quarter of 2010. In addition, United plans to add service to Lagos, Nigeria, pending government approvals;
• The Company will offer a new non-stop flight between O’Hare and Brussels, Belgium and will extend its existing daily Washington Dulles-Kuwait
flight to include a direct flight to Bahrain, starting in March and April 2010, respectively; and
• The Company entered into a joint venture to offer service from Washington Dulles to Madrid beginning March 2010.
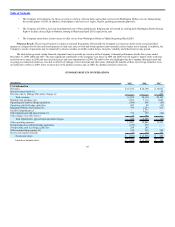
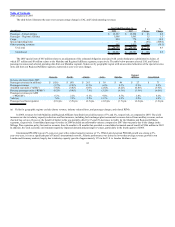
Financial Results. The air travel business is subject to seasonal fluctuations. Historically, the Company’s revenues are better in the second and third
quarters as compared to the first and fourth quarters of each year, since its first and fourth quarter results normally reflect weaker travel demand. In addition, the
Company’s results of operations may be impacted by adverse weather, air traffic control delays, fuel price volatility and other factors in any period.
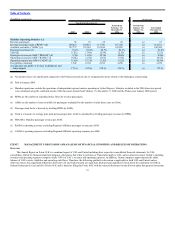
The table below presents certain financial statement items to provide an overview of the Company’s financial performance for the three years ended
December 31, 2009, 2008 and 2007. The most significant contributors to the Company’s net losses in 2009 and 2008 were the negative impact of the economic
recession on revenues in 2009 and increased fuel prices and asset impairments in 2008. The table below also highlights that the Company, through its past and
on-going cost reduction initiatives, was able to effectively manage costs in non-fuel and other areas, although the benefits of these cost savings initiatives were
not sufficient to offset, in 2009, lower revenues due to the global recession, and, in 2008, the dramatic increase in fuel cost.
SUMMARY RESULTS OF OPERATIONS
(In millions) 2009 2008 2007
UAL information
Revenues $ 16,335 $ 20,194 $ 19,852
Special revenue items (a) — — 45
Revenues due to Mileage Plus policy change (a) — — 246
Total revenues 16,335 20,194 20,143
Mainline fuel purchase cost 3,509 7,114 5,086
Operating non-cash fuel hedge (gain)/loss (586) 568 (20)
Operating cash fuel hedge (gain)/loss 482 40 (63)
Regional Affiliates fuel expense (b) 799 1,257 915
Goodwill impairment (c) — 2,277 —
Other impairments and special items (c) 374 339 (44)
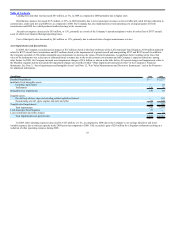
Other charges (see table below) 35 191 —
Total impairments, special items and other charges 409 2,807 (44)
Other operating expenses 11,883 12,846 13,232
Nonoperating non-cash fuel hedge (gain)/loss (279) 279 —
Nonoperating cash fuel hedge (gain)/loss 248 249 —
Other nonoperating expense (d) 538 455 380
Income tax expense (benefit) (17) (25) 297
Net income (loss) $ (651) $ (5,396) $ 360
United net income (loss) $ (628) $ (5,354) $ 359
38