United Airlines 2009 Annual Report Download - page 78
Download and view the complete annual report
Please find page 78 of the 2009 United Airlines annual report below. You can navigate through the pages in the report by either clicking on the pages listed below, or by using the keyword search tool below to find specific information within the annual report.-
 1
1 -
2
-
3
-
4
-
5
-
6
-
7
-
8
-
9
-
10
-
11
-
12
-
13
-
14
-
15
-
16
-
17
-
18
-
19
-
20
-
21
-
22
-
23
-
24
-
25
-
26
-
27
-
28
-
29
-
30
-
31
-
32
-
33
-
34
-
35
-
36
-
37
-
38
-
39
-
40
-
41
-
42
-
43
-
44
-
45
-
46
-
47
-
48
-
49
-
50
-
51
-
52
-
53
-
54
-
55
-
56
-
57
-
58
-
59
-
60
-
61
-
62
-
63
-
64
-
65
-
66
-
67
-
 68
68 -
 69
69 -
 70
70 -
 71
71 -
 72
72 -
 73
73 -
 74
74 -
 75
75 -
 76
76 -
 77
77 -
 78
78 -
 79
79 -
 80
80 -
 81
81 -
 82
82 -
 83
83 -
 84
84 -
 85
85 -
 86
86 -
 87
87 -
 88
88 -
89
-
90
-
91
-
92
-
93
-
94
-
95
-
96
-
97
-
98
-
99
-
100
-
101
-
102
-
103
-
104
-
105
-
106
-
107
-
108
-
109
-
110
-
111
-
112
-
113
-
114
-
115
-
116
-
117
-
118
-
119
-
120
-
121
-
122
-
123
-
124
-
125
-
126
-
127
-
128
-
129
-
130
-
131
-
132
-
133
-
134
-
135
-
136
-
137
-
138
-
139
-
140
-
141
-
142
-
143
-
144
-
145
-
146
-
147
-
148
-
149
-
150
-
151
-
152
-
153
-
154
-
155
-
156
-
157
-
158
-
159
-
160
-
161
-
162
-
163
-
164
-
165
-
166
-
167
-
168
-
169
-
170
-
171
-
172
-
173
-
174
-
175
-
176
 |
 |

Table of Contents
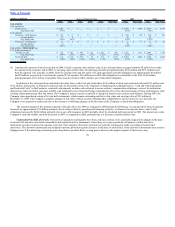
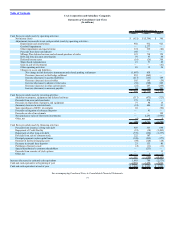
UAL Corporation and Subsidiary Companies
Statements of Consolidated Operations
(In millions, except per share amounts)
Year Ended December 31,
2009 2008 2007
Operating revenues:
Passenger—United Airlines $ 11,910 $ 15,337 $ 15,254
Passenger—Regional Affiliates 3,064 3,098 3,063
Cargo 536 854 770
Special operating items (Note 18) — — 45
Other operating revenues 825 905 1,011
16,335 20,194 20,143
Operating expenses:
Salaries and related costs 3,773 4,311 4,261
Aircraft fuel 3,405 7,722 5,003
Regional Affiliates 2,939 3,248 2,941
Purchased services 1,167 1,375 1,346
Aircraft maintenance materials and outside repairs 965 1,096 1,166
Landing fees and other rent 905 862 876
Depreciation and amortization 902 932 925
Distribution expenses 534 710 779
Aircraft rent 346 409 406
Cost of third party sales 230 272 316
Goodwill impairment (Note 3) — 2,277 —
Other impairments and special items (Notes 3 and 18) 374 339 (44)
Other operating expenses 956 1,079 1,131
16,496 24,632 19,106
Earnings (loss) from operations (161) (4,438) 1,037
Other income (expense):
Interest expense (577) (571) (704)
Interest income 19 112 257
Interest capitalized 10 20 19
Gain on sale of investment (Note 19) — — 41
Miscellaneous, net (Note 12) 37 (550) 2
(511) (989) (385)
Earnings (loss) before income taxes and equity in earnings of affiliates (672) (5,427) 652
Income tax expense (benefit) (17) (25) 297
Earnings (loss) before equity in earnings of affiliates (655) (5,402) 355
Equity in earnings of affiliates, net of tax 4 6 5
Net income (loss) $ (651) $ (5,396) $ 360
Earnings (loss) per share, basic $ (4.32) $ (42.59) $ 2.94
Earnings (loss) per share, diluted $ (4.32) $ (42.59) $ 2.65
See accompanying Combined Notes to Consolidated Financial Statements.
74