United Airlines 2009 Annual Report Download - page 111
Download and view the complete annual report
Please find page 111 of the 2009 United Airlines annual report below. You can navigate through the pages in the report by either clicking on the pages listed below, or by using the keyword search tool below to find specific information within the annual report.-
 1
1 -
2
-
3
-
4
-
5
-
6
-
7
-
8
-
9
-
10
-
11
-
12
-
13
-
14
-
15
-
16
-
17
-
18
-
19
-
20
-
21
-
22
-
23
-
24
-
25
-
26
-
27
-
28
-
29
-
30
-
31
-
32
-
33
-
34
-
35
-
36
-
37
-
38
-
39
-
40
-
41
-
42
-
43
-
44
-
45
-
46
-
47
-
48
-
49
-
50
-
51
-
52
-
53
-
54
-
55
-
56
-
57
-
58
-
59
-
60
-
61
-
62
-
63
-
64
-
65
-
66
-
67
-
68
-
69
-
70
-
71
-
72
-
73
-
74
-
75
-
76
-
77
-
78
-
79
-
80
-
81
-
82
-
83
-
84
-
85
-
86
-
87
-
88
-
89
-
90
-
91
-
92
-
93
-
94
-
95
-
96
-
97
-
98
-
99
-
100
-
 101
101 -
 102
102 -
 103
103 -
 104
104 -
 105
105 -
 106
106 -
 107
107 -
 108
108 -
 109
109 -
 110
110 -
 111
111 -
 112
112 -
 113
113 -
 114
114 -
 115
115 -
 116
116 -
 117
117 -
 118
118 -
 119
119 -
 120
120 -
 121
121 -
122
-
123
-
124
-
125
-
126
-
127
-
128
-
129
-
130
-
131
-
132
-
133
-
134
-
135
-
136
-
137
-
138
-
139
-
140
-
141
-
142
-
143
-
144
-
145
-
146
-
147
-
148
-
149
-
150
-
151
-
152
-
153
-
154
-
155
-
156
-
157
-
158
-
159
-
160
-
161
-
162
-
163
-
164
-
165
-
166
-
167
-
168
-
169
-
170
-
171
-
172
-
173
-
174
-
175
-
176
 |
 |

Table of Contents
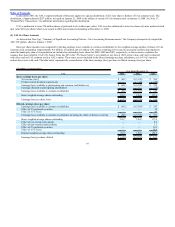
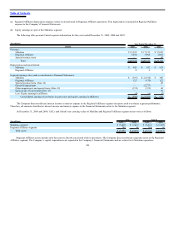
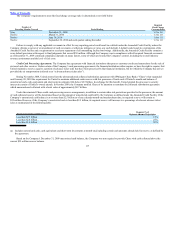
The fair values of the Company’s pension plan and other benefit plan assets at December 31, 2009, by asset category, are as follows:
(In millions)
December 31,
2009
Fair Value Measurements at Reporting
Date Using
Quoted Prices in
Active Markets
for
Identical Assets
(Level 1)
Significant
Other
Observable
Inputs
(Level 2)
Significant
Unobservable
Inputs
(Level 3)
Pension Plan Assets:
Fixed income funds $ 25 $ — $ 25 $ —
Equity funds 81 — 81 —
Annuity insurance contract 41 — — 41
Other investments 9 — 9 —
Total $ 156 $ — $ 115 $ 41
Other Benefit Plan Assets:
Deposit administration fund $ 58 $ — $ — $ 58
Level 3 Financial Assets and Liabilities—All
(In millions)
Balance at January 1, 2009 $103
Purchases 10
Sales (16)
Return on plan assets 2
Balance at December 31, 2009 $ 99
Fixed income and equity funds. The fair market value reflects the combined market value of the underlying stock and/or market value of the underlying
debt securities. The market value of the common stock portion, if any, of the fund is based on the primary-exchange closing prices of the stocks of the fund.
Insurance contract and deposit administration fund. Both of these investments are stable investment vehicles structured to provide investment income.
Generally, the deposit administration fund assets are not subject to market volatilities as the fund earns a stated return, determined at the beginning of each year.
Similarly, the insurance contract is not subject to market volatility. Due to the conservative nature of the underlying assets, the cost of these investments
approximates their fair value.
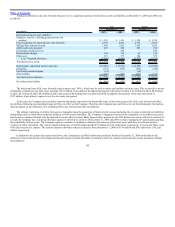
Expected 2010 employer contributions are $12 million for the pension plans and $153 million for the other postretirement benefit plans. The following
benefit payments are expected to be made by the Company in future years for the Company’s retirement plans:
(In millions) Pension
Other
Benefits
Other Benefits—
subsidy receipts
2010 $ 10 $ 155 $ 13
2011 11 157 15
2012 11 156 17
2013 12 156 19
2014 12 160 21
Years 2015 – 2019 58 864 131
107