United Airlines 2009 Annual Report Download - page 123
Download and view the complete annual report
Please find page 123 of the 2009 United Airlines annual report below. You can navigate through the pages in the report by either clicking on the pages listed below, or by using the keyword search tool below to find specific information within the annual report.
Table of Contents
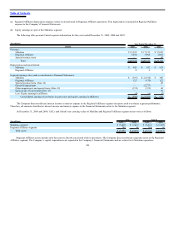
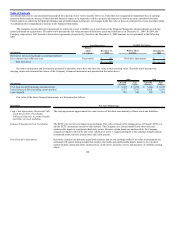
The table below presents disclosures about the fair value of financial assets and financial liabilities recognized in the Company’s Financial Statements.
Fair Value Measurements at Reporting Date Using
(In millions)
December 31,
2009
Quoted Prices in
Active Markets
for
Identical Assets
(Level 1)
Significant Other
Observable
Inputs
(Level 2)
Significant
Unobservable
Inputs
(Level 3)
Assets and Liabilities Measured at Fair Value on a
Recurring Basis:
Financial assets:
Noncurrent EETC available-for-sale securities $ 51 $ — $ — $ 51
Current fuel derivative instruments 138 — 138 —
Fuel derivative instrument receivables (a) 22 — 22 —
Total financial assets $ 211 $ — $ 160 $ 51
Financial liabilities:
Current fuel derivative instruments $ 5 $ — $ 5
Fuel derivative instrument payables (a) 15 — 15
Total financial liabilities $ 20 $ — $ 20
December 31,
2008
Financial assets:
Noncurrent EETC available-for-sale securities $ 46 $ — $ — $ 46
Foreign currency receivables 10 — 10 —
Total financial assets $ 56 $ — $ 10 $ 46
Financial liabilities:
Fuel derivative instrument payables (a) $ (140) $ — $ (140)
Fuel derivative instruments (b) (727) — (727)
Total financial liabilities $ (867) $ — $ (867)
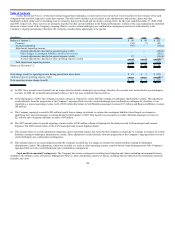
(a) Fuel derivative instrument receivables and payables represent pending settlements of contract premiums and expired contracts. See below for further
discussion of fuel derivative gains and losses.
(b) As of December 31, 2008, $9 million of the total fuel derivative payable was classified as a noncurrent liability. See below for further discussion of fuel
derivative gains and losses.
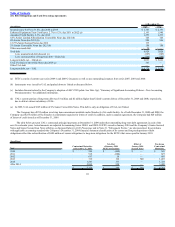
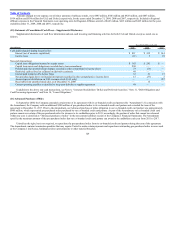
Level 3 Financial Assets and Liabilities
Available-for-Sale
Securities
(In millions) 2009 2008
Balance at January 1, $ 46 $ 91
Unrealized gains (losses) relating to instruments held at reporting date 15 (37)
Sales, return of principal and other (10) (8)
Balance at December 31, $ 51 $ 46
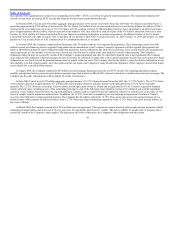
As of December 31, 2009, the Company’s EETC securities have an amortized cost basis of $73 million and unrealized losses of $22 million and represent
a portion of the Company’s previously issued and outstanding EETC securities which were repurchased in open market transactions in 2007. As of December 31,
2009, these
119


