Rogers 2015 Annual Report Download - page 98
Download and view the complete annual report
Please find page 98 of the 2015 Rogers annual report below. You can navigate through the pages in the report by either clicking on the pages listed below, or by using the keyword search tool below to find specific information within the annual report.-
 1
1 -
2
-
3
-
4
-
5
-
6
-
7
-
8
-
9
-
10
-
11
-
12
-
13
-
14
-
15
-
16
-
17
-
18
-
19
-
20
-
21
-
22
-
23
-
24
-
25
-
26
-
27
-
28
-
29
-
30
-
31
-
32
-
33
-
34
-
35
-
36
-
37
-
38
-
39
-
40
-
41
-
42
-
43
-
44
-
45
-
46
-
47
-
48
-
49
-
50
-
51
-
52
-
53
-
54
-
55
-
56
-
57
-
58
-
59
-
60
-
61
-
62
-
63
-
64
-
65
-
66
-
67
-
68
-
69
-
70
-
71
-
72
-
73
-
74
-
75
-
76
-
77
-
78
-
79
-
80
-
81
-
82
-
83
-
84
-
85
-
86
-
87
-
 88
88 -
 89
89 -
 90
90 -
 91
91 -
 92
92 -
 93
93 -
 94
94 -
 95
95 -
 96
96 -
 97
97 -
 98
98 -
 99
99 -
 100
100 -
 101
101 -
 102
102 -
 103
103 -
 104
104 -
 105
105 -
 106
106 -
 107
107 -
 108
108 -
109
-
110
-
111
-
112
-
113
-
114
-
115
-
116
-
117
-
118
-
119
-
120
-
121
-
122
-
123
-
124
-
125
-
126
-
127
-
128
-
129
-
130
-
131
-
132
-
133
-
134
-
135
-
136
-
137
-
138
-
139
-
140
-
141
-
142
-
143
-
144
-
145
-
146
 |
 |

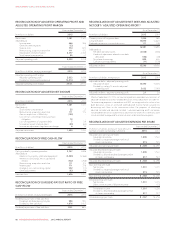
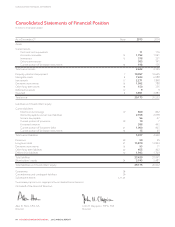
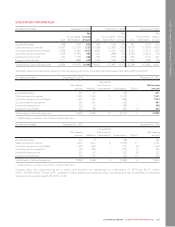
CONSOLIDATED FINANCIAL STATEMENTS
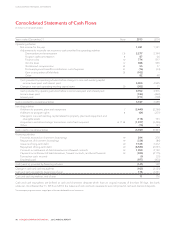
Consolidated Statements of Cash Flows
(In millions of Canadian dollars)
Years ended December 31 Note 2015 2014
Operating activities:
Net income for the year 1,381 1,341
Adjustments to reconcile net income to cash provided by operating activities:
Depreciation and amortization 7, 8 2,277 2,144
Program rights amortization 887 66
Finance costs 10 774 817
Income taxes 12 466 506
Stock-based compensation 25 55 37
Post-employment benefits contributions, net of expense 23 (16) (34)
Gain on acquisition of Mobilicity 26 (102) –
Other 82 48
Cash provided by operating activities before changes in non-cash working capital,
income taxes paid, and interest paid 5,004 4,925
Change in non-cash operating working capital items 30 (302) 11
Cash provided by operating activities before income taxes paid and interest paid 4,702 4,936
Income taxes paid (184) (460)
Interest paid (771) (778)
Cash provided by operating activities 3,747 3,698
Investing activities:
Additions to property, plant and equipment 7(2,440) (2,366)
Additions to program rights 8(64) (231)
Changes in non-cash working capital related to property, plant and equipment and
intangible assets (116) 153
Acquisitions and other strategic transactions, net of cash acquired 8, 17, 26 (1,077) (3,456)
Other (70) (51)
Cash used in investing activities (3,767) (5,951)
Financing activities:
Proceeds received on short-term borrowings 19 294 276
Repayment of short-term borrowings 19 (336) (84)
Issuance of long-term debt 30 7,338 3,412
Repayment of long-term debt 30 (6,584) (2,551)
Proceeds on settlement of debt derivatives and forward contracts 30 1,059 2,150
Payments on settlement of debt derivatives, forward contracts, and bond forwards 30 (930) (2,115)
Transaction costs incurred (9) (30)
Dividends paid (977) (930)
Cash (used in) provided by financing activities (145) 128
Change in cash and cash equivalents (165) (2,125)
Cash and cash equivalents, beginning of year 176 2,301
Cash and cash equivalents, end of year 11 176
Cash and cash equivalents are defined as cash and short-term deposits which have an original maturity of less than 90 days, less bank
advances. As at December 31, 2015 and 2014, the balance of cash and cash equivalents was comprised of cash and demand deposits.
The accompanying notes are an integral part of the consolidated financial statements.
96 ROGERS COMMUNICATIONS INC. 2015 ANNUAL REPORT