Rogers 2015 Annual Report Download - page 111
Download and view the complete annual report
Please find page 111 of the 2015 Rogers annual report below. You can navigate through the pages in the report by either clicking on the pages listed below, or by using the keyword search tool below to find specific information within the annual report.-
 1
1 -
2
-
3
-
4
-
5
-
6
-
7
-
8
-
9
-
10
-
11
-
12
-
13
-
14
-
15
-
16
-
17
-
18
-
19
-
20
-
21
-
22
-
23
-
24
-
25
-
26
-
27
-
28
-
29
-
30
-
31
-
32
-
33
-
34
-
35
-
36
-
37
-
38
-
39
-
40
-
41
-
42
-
43
-
44
-
45
-
46
-
47
-
48
-
49
-
50
-
51
-
52
-
53
-
54
-
55
-
56
-
57
-
58
-
59
-
60
-
61
-
62
-
63
-
64
-
65
-
66
-
67
-
68
-
69
-
70
-
71
-
72
-
73
-
74
-
75
-
76
-
77
-
78
-
79
-
80
-
81
-
82
-
83
-
84
-
85
-
86
-
87
-
88
-
89
-
90
-
91
-
92
-
93
-
94
-
95
-
96
-
97
-
98
-
99
-
100
-
 101
101 -
 102
102 -
 103
103 -
 104
104 -
 105
105 -
 106
106 -
 107
107 -
 108
108 -
 109
109 -
 110
110 -
 111
111 -
 112
112 -
 113
113 -
 114
114 -
 115
115 -
 116
116 -
 117
117 -
 118
118 -
 119
119 -
 120
120 -
 121
121 -
122
-
123
-
124
-
125
-
126
-
127
-
128
-
129
-
130
-
131
-
132
-
133
-
134
-
135
-
136
-
137
-
138
-
139
-
140
-
141
-
142
-
143
-
144
-
145
-
146
 |
 |

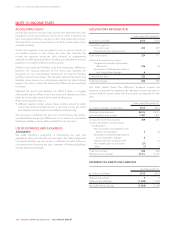
NOTES TO CONSOLIDATED FINANCIAL STATEMENTS
spectrum covering most of the Canadian population. We paid a
total of $3,301 million to Innovation, Science and Economic
Development Canada (formerly Industry Canada) for the licences,
which included $9 million of costs directly attributable to the
acquisition of the spectrum licences, and recognized the spectrum
licences of $3,301 million as intangible assets.
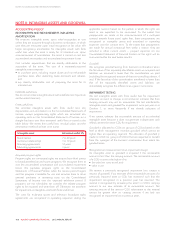
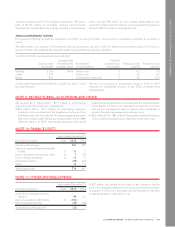
ANNUAL IMPAIRMENT TESTING
For purposes of testing goodwill for impairment, our CGUs, or groups of CGUs, correspond to our operating segments as disclosed in
note 4.
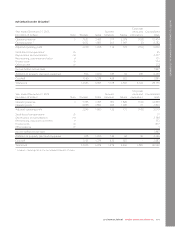
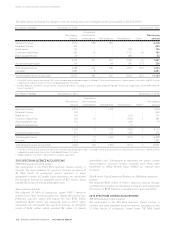
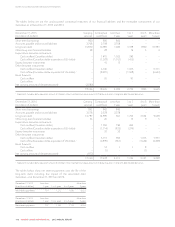
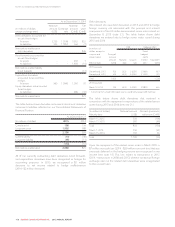
The table below is an overview of the methods and key assumptions we used in 2015 to determine recoverable amounts for CGUs or
groups of CGUs, with indefinite-life intangible assets or goodwill that we consider significant.
(In millions of dollars, except periods used and rates)
Carrying value
of goodwill
Carrying value
of indefinite-life
intangible assets
Recoverable
amount method
Period of
projected cash
flows (years)
Terminal growth
rates (%)
Pre-tax discount
rates (%)
Wireless 1,160 6,416 Value in use 5 0.5 7.9
Cable 1,379 – Value in use 5 2.0 8.5
Media 923 – Fair value less cost to sell 5 2.0 10.4
Our fair value measurement for Media is classified as Level 3 in the
fair value hierarchy.
We did not recognize an impairment charge in 2015 or 2014
because the recoverable amounts of the CGUs exceeded their
carrying values.
NOTE 9: RESTRUCTURING, ACQUISITION AND OTHER
We incurred $111 million (2014 – $173 million) in restructuring,
acquisition and other expenses, comprised of:
• $75 million (2014 – $131 million) of restructuring expenses,
mainly for costs associated with the targeted restructuring of our
employee base and the write-off of certain programming rights
that are no longer usable following a reorganization of the OMNI
television stations. In 2014, restructuring expenses were mainly
related to the reorganization associated with the implementation
of the Rogers 3.0 plan to structure teams around our customers
and remove management layers to ensure senior leadership is
closer to frontline employees and customers; and
• $36 million (2014 – $42 million) of acquisition-related transaction
costs, contract termination costs, legal claims and other costs.
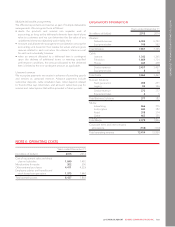
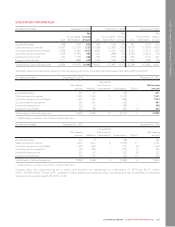
NOTE 10: FINANCE COSTS
Years ended December 31
(In millions of dollars) Note 2015 2014
Interest on borrowings 761 782
Interest on post-employment benefits
liability 23 11 7
Loss on repayment of long-term debt 16 729
Loss on foreign exchange 21 11 11
Capitalized interest (29) (26)
Other 13 14
Total finance costs 774 817
NOTE 11: OTHER (INCOME) EXPENSE
Years ended December 31
(In millions of dollars) Note 2015 2014
Losses from associates and joint
ventures 99 23
Gain on acquisition of Mobilicity 26 (102) –
Other investment income (29) (22)
Total other (income) expense (32) 1
A $72 million loss related to our share of the change in the fair
value of an obligation relating to one of our joint ventures has been
recognized in losses from associates and joint ventures for the year
ended December 31, 2015 (2014 – nil).
2015 ANNUAL REPORT ROGERS COMMUNICATIONS INC. 109