Rogers 2015 Annual Report Download - page 50
Download and view the complete annual report
Please find page 50 of the 2015 Rogers annual report below. You can navigate through the pages in the report by either clicking on the pages listed below, or by using the keyword search tool below to find specific information within the annual report.-
 1
1 -
2
-
3
-
4
-
5
-
6
-
7
-
8
-
9
-
10
-
11
-
12
-
13
-
14
-
15
-
16
-
17
-
18
-
19
-
20
-
21
-
22
-
23
-
24
-
25
-
26
-
27
-
28
-
29
-
30
-
31
-
32
-
33
-
34
-
35
-
36
-
37
-
38
-
39
-
 40
40 -
 41
41 -
 42
42 -
 43
43 -
 44
44 -
 45
45 -
 46
46 -
 47
47 -
 48
48 -
 49
49 -
 50
50 -
 51
51 -
 52
52 -
 53
53 -
 54
54 -
 55
55 -
 56
56 -
 57
57 -
 58
58 -
 59
59 -
 60
60 -
61
-
62
-
63
-
64
-
65
-
66
-
67
-
68
-
69
-
70
-
71
-
72
-
73
-
74
-
75
-
76
-
77
-
78
-
79
-
80
-
81
-
82
-
83
-
84
-
85
-
86
-
87
-
88
-
89
-
90
-
91
-
92
-
93
-
94
-
95
-
96
-
97
-
98
-
99
-
100
-
101
-
102
-
103
-
104
-
105
-
106
-
107
-
108
-
109
-
110
-
111
-
112
-
113
-
114
-
115
-
116
-
117
-
118
-
119
-
120
-
121
-
122
-
123
-
124
-
125
-
126
-
127
-
128
-
129
-
130
-
131
-
132
-
133
-
134
-
135
-
136
-
137
-
138
-
139
-
140
-
141
-
142
-
143
-
144
-
145
-
146
 |
 |

MANAGEMENT’S DISCUSSION AND ANALYSIS
MEDIA
DIVERSIFIED CANADIAN MEDIA COMPANY
We have a broad portfolio of media properties, which most
significantly includes:
• sports media and entertainment, such as the Toronto Blue
Jays;
• our exclusive national 12-year NHL Agreement;
• category-leading television and radio broadcasting
properties;
• multi-platform televised and online shopping;
• publishing including Texture by Next Issue; and
• digital media.
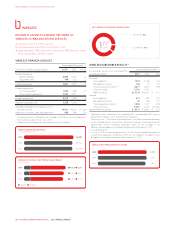
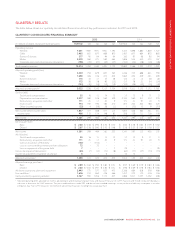
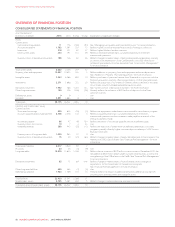
MEDIA FINANCIAL RESULTS
Years ended December 31
(In millions of dollars, except margins) 2015 2014 % Chg
Operating revenue 2,079 1,826 14
Operating expenses 1,907 1,695 13
Adjusted operating profit 172 131 31
Adjusted operating profit margin 8.3% 7.2% 1.1 pts
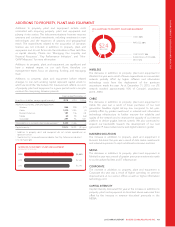
Additions to property, plant and equipment 60 94 (36)
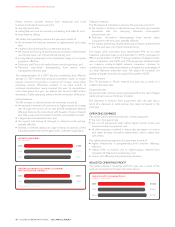
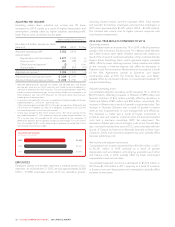
OPERATING REVENUE
Media generates revenue in five areas:
• advertising sales across its television, radio, publishing, and
digital media properties;
• subscriptions to televised products;
• retail product sales;
• circulation of published products; and
• ticket sales, receipts of MLB revenue sharing, and concession
sales associated with Sports Media and Entertainment.
(IN MILLIONS OF DOLLARS)
MEDIA OPERATING REVENUE
2015
2014
2013
$2,079
$1,826
$1,704
(%)
2015 MEDIA OPERATING REVENUE MIX
SPORTS 52%
BROADCASTING 26%
THE SHOPPING CHANNEL 13%
PUBLISHING 9%
$2.1
BILLION
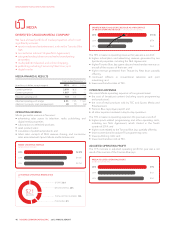
2015
2014
2013
$1,106
$778
$634
52%
43%
37%
SPORTS REVENUE AND SPORTS REVENUE AS A PERCENTAGE
OF MEDIA OPERATING REVENUE (% or IN MILLIONS OF DOLLARS)
The 14% increase in operating revenue this year was a result of:
• higher subscription and advertising revenue generated by our
Sportsnet properties, including the NHL Agreement;
• higher Toronto Blue Jays game day and merchandise revenue as
a result of the success of the team; and
• higher revenue generated from Texture by Next Issue; partially
offset by
• continued softness in conventional television and print
advertising; and
• lower merchandise sales at TSC.
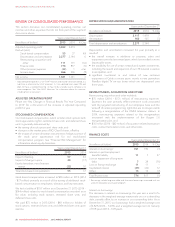
OPERATING EXPENSES
We assess Media operating expenses in four general areas:
• the cost of broadcast content (including sports programming
and production);
• the cost of retail products sold by TSC and Sports Media and
Entertainment;
• Toronto Blue Jays player payroll; and
• all other expenses involved in day-to-day operations.
The 13% increase in operating expenses this year was a result of:
• higher sports-related programming and other operating costs,
including our NHL Agreement, which started in the fourth
quarter of 2014; and
• higher costs related to the Toronto Blue Jays; partially offset by
• lower conventional broadcast TV programming costs;
• lower publishing costs; and
• lower merchandise costs at TSC.
ADJUSTED OPERATING PROFIT
The 31% increase in adjusted operating profit this year was a net
result of the success of the Toronto Blue Jays.
(IN MILLIONS OF DOLLARS)
MEDIA ADJUSTED OPERATING PROFIT
2015
2014
2013
$172
$131
$161
48 ROGERS COMMUNICATIONS INC. 2015 ANNUAL REPORT